Telecom Customer Churn Analysis Project
Samuel Olunloyo
Telecom Customer Churn Analysis
Project Background
As a Data Analyst at a major telecommunications company, my role involves leveraging data to drive strategic business decisions. This company has been a competitive player in the industry for over two decades, providing essential services like mobile, internet, and fixed-line connectivity. Our business model is subscription-based, relying on recurring revenue from individual and corporate customers for various service packages. Key business metrics we monitor closely include Customer Churn Rate, Customer Lifetime Value (CLV), Average Revenue Per User (ARPU), and Subscriber Growth. The primary focus of this project was to analyze customer demographics, service usage, and geographic location to identify key drivers of churn and provide actionable recommendations to improve customer retention.
Insights and recommendations are provided on the following key areas: Category 1: Customer Demographics (Age and Gender) Category 2: Customer Geography (Location) Category 3: Service Usage and Dissatisfaction Category 4: Churn Prediction
The SQL queries used to inspect and clean the data for this analysis can be found in the project files under the SQL directory. Targeted SQL queries regarding various business questions can be found in the project files under the SQL directory. An interactive Power BI dashboard used to report and explore sales trends can be found here [link].
Data Structure & Initial Checks
The company's main database structure as seen below consists of four core analytical tables, along with a final prediction table, stemming from a primary dataset with a total row count of 6,418 records.
Table Name Description Rows
prod_Churn The main production table containing cleaned, transformed, and ready-to-analyze customer data, including demographics, account information, and the final Churn Status. 6,418 prod_Services A structure created by unpivoting the service-related columns (e.g., Online Security, Streaming TV) for granular analysis of individual service usage and its correlation with churn. 77,016 mapping_AgeGroup A dimension table used to categorize the continuous Age column into discrete 'Age Group' segments for aggregated demographic analysis. 68 mapping_TenureGroup A dimension table used to categorize the continuous Tenure in Months column into time-based bins ('Tenure Group') for analyzing churn based on customer longevity. 36 Predictions Contains customer records that were predicted to churn by the Random Forest ML model, used for proactive retention efforts. 377Executive Summary
Overview of Findings
Stakeholders, such as the Marketing Manager, should know three main things: 1) Customers aged 50+ are our most vulnerable segment for churn ( ≈ 31.0 ), particularly women, indicating a need for targeted retention efforts and services. 2) While churn is distributed across locations, the Jammu & Kashmir region exhibits an alarmingly high churn rate of 57.2 , demanding immediate attention to service quality or competitor activity there. 3) Dissatisfaction with 'Paperless Service' and 'Internet services' are significant internal drivers of churn, compounded by external factors like better competitor offers and devices.
Insights Deep Dive
Category 1: Customer Demographics (Age and Gender)
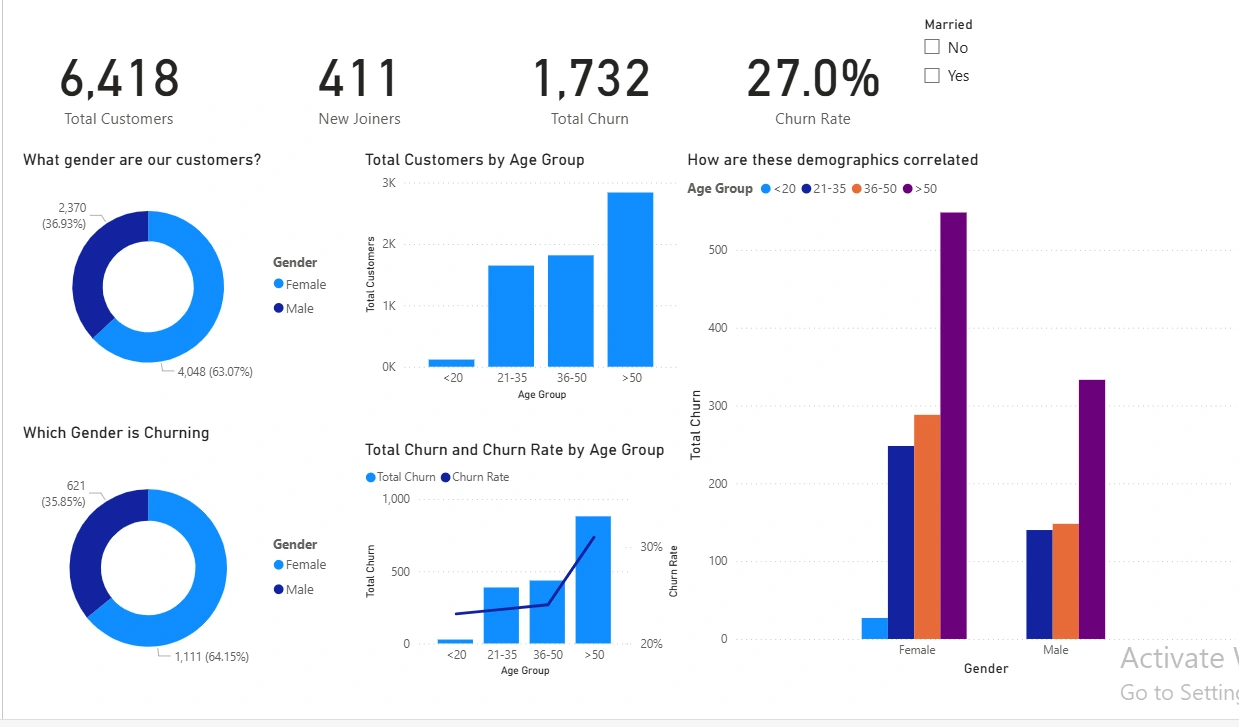
Main insight 1. The majority of our customer base and churners are female, but gender is not a strong predictor of churn. More detail about the supporting analysis about this insight, including time frames, quantitative values, and observations about trends: Approximately 63.07 of our total customers are female, and they account for 64.15 of the churners. The overall churn rate for both genders is stable, with both male and female churn rates falling within the 26 range.
Main insight 2. Customers aged 50+ represent the largest customer base and the highest churn risk. More detail about the supporting analysis about this insight, including time frames, quantitative values, and observations about trends: Our largest customer base consists of people above 50 years old, with over 2,800 customers in this demographic. This group also has the highest churn rate, which skyrockets to a peak of 31.0 for the 50+ age range.
Main insight 3. Women aged 50+ are the highest-churning demographic, but the pattern is consistent across genders in this age group. More detail about the supporting analysis about this insight, including time frames, quantitative values, and observations about trends: We are losing women above 50 at the highest rate of 31.5 . The same high churn rate is observed for men in the same age bracket, showing that age is one of the most consistent patterns for churning.
Main insight 4. Marital status shows a thin correlation with churn probability. More detail about the supporting analysis about this insight, including time frames, quantitative values, and observations about trends: Although by a very thin margin, customers who are not married seem to churn more compared to those who are married.
Category 2: Customer Geography (Location)
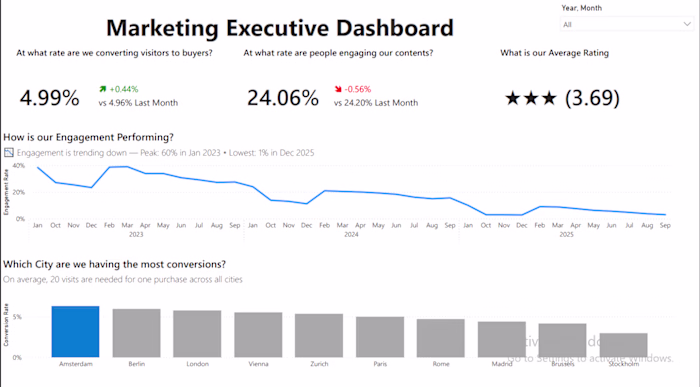
Main insight 1. Uttar Pradesh has the highest absolute number of churners, expected due to its large customer base. More detail about the supporting analysis about this insight, including time frames, quantitative values, and observations about trends: Uttar Pradesh hosts the majority of our customers, which leads to the highest absolute number of churners (count of 157). Churn counts across the top 10 locations are relatively consistent, with the lowest in that group being 74.
Main insight 2. Jammu & Kashmir exhibits an abnormally high churn rate, highlighting a localized retention crisis. More detail about the supporting analysis about this insight, including time frames, quantitative values, and observations about trends: Jammu & Kashmir has an alarming churn rate of 57.2 (183 churners), meaning we are losing, on average, more than one out of every two customers in that region.
Main insight 3. Two other regions show significantly elevated churn rates. More detail about the supporting analysis about this insight, including time frames, quantitative values, and observations about trends: Two other states show major spikes in their churn rates: Assam at 38.1 and Jharkhand at 34.5 . These rates are substantially higher than the national average and require specific competitor and service quality investigation.
Main insight 4. The overall churning pattern is not consistently location-based, except for the high-churn outlier regions. More detail about the supporting analysis about this insight, including time frames, quantitative values, and observations about trends: The high churn probability is concentrated in a few outliers, suggesting that while local factors are critical in those states (Jammu & Kashmir, Assam, and Jharkhand), the core churn issue across the rest of the country is service or demographic related.
Category 3: Service Usage and Dissatisfaction
Main insight 1. "Paperless Service" users are churning at a significantly high rate. More detail about the supporting analysis about this insight, including time frames, quantitative values, and observations about trends: The use of the Paperless Service needs urgent attention, as 34 of customers who utilize this service have churned. This suggests a potential issue with the service's quality, accessibility, or reliability.
Main insight 2. Users of "Internet services" also show a high propensity for churn. More detail about the supporting analysis about this insight, including time frames, quantitative values, and observations about trends: Customers using our Internet services are churning at a high rate of 32 . This internal data point indicates that service quality, such as speed or reliability, may be a major factor contributing to dissatisfaction.
Main insight 3. The main reported reasons for churn are competitor-related. More detail about the supporting analysis about this insight, including time frames, quantitative values, and observations about trends: A primary cause of churn, according to the data, is that our competitors have better devices and a competitor made a better offer. This points to pricing, device subsidies, and hardware quality being significant market differentiators.
Main insight 4. Customer support quality is an important internal factor contributing to churn. More detail about the supporting analysis about this insight, including time frames, quantitative values, and observations about trends: The Attitude of the Support person is explicitly cited as an important reason why people are churning. This highlights a need for better training and quality control for our customer service and support teams.
Category 4: Churn Prediction
Main insight 1. The Machine Learning Model predicts a significant number of customers are at risk of churning. More detail about the supporting analysis about this insight, including time frames, quantitative values, and observations about trends: The Random Forest Machine Learning Model predicts a total of 377 customers are expected to churn in the near future. This forms the basis for a highly targeted, proactive retention strategy.
Main insight 2. The predicted churners disproportionately reflect the general churn trends for gender. More detail about the supporting analysis about this insight, including time frames, quantitative values, and observations about trends: Of the predicted churners, 243 are women and 134 are men. This ratio is consistent with the general customer base distribution.
Main insight 3. Age 50+ is a significant risk factor among the predicted churners. More detail about the supporting analysis about this insight, including time frames, quantitative values, and observations about trends: A substantial portion of the predicted churners—140 of them—are above the age of 50, reinforcing this age group as the most critical segment for retention efforts.
Main insight 4. Uttar Pradesh still represents the largest absolute number of predicted churners by location. More detail about the supporting analysis about this insight, including time frames, quantitative values, and observations about trends: Due to its large customer base, 44 of the predicted churners are expected to be living in Uttar Pradesh. While the high-rate areas need investigation, Uttar Pradesh requires high-volume retention strategies.
Recommendations:
Based on the insights and findings above, we would recommend the Customer Retention Team and Marketing Department to consider the following:
Customers aged 50+ show the highest churn rate ( ≈ 31.0 ). Implement a targeted retention campaign (e.g., specialized service packages or loyalty discounts) specifically designed for the 50+ age demographic.
The Jammu & Kashmir region has an extreme churn rate of 57.2 . Launch an urgent, localized investigation in Jammu & Kashmir (and secondary focus on Assam and Jharkhand) to determine if the cause is service infrastructure issues or specific competitor tactics.
34 of Paperless Service users and 32 of Internet Service users have churned. Audit the quality and user experience of both the Paperless Service and Internet services immediately, allocating resources to resolve any underlying technical issues.
Competitor offers and better devices are cited as top reasons for churn. Review and revise current device upgrade policies and core service pricing to maintain competitiveness and improve the perceived value of our offerings.
The attitude of support staff is noted as a reason for churn. Mandate improved training and implement a Quality Assurance program for customer support personnel, focusing on empathy and efficient issue resolution.
Assumptions and Caveats:
Throughout the analysis, multiple assumptions were made to manage challenges with the data. These assumptions and caveats are noted below:
Missing values were imputed using a business-driven approach in SQL. (ex: Nulls in service feature columns like
Online_Security and Multiple_Lines were re-coded to 'No' to ensure data integrity, assuming a null value in a feature column means the customer does not subscribe to that feature).The Machine Learning model was trained only on 'Churned' and 'Stayed' customers. (ex: Customers with
Customer_Status = 'Joined' were excluded from the model training to focus the prediction on established customer behavior, then the model was applied to the 'Joined' group to predict future churners).Categorical data was label-encoded for the Random Forest model. (ex: Categorical variables were converted to numerical representations using
LabelEncoder in Python, which is a common practice for tree-based models like Random Forest).Loading this content connects you to GitHub Gist.
GitHub Gist privacy informationLike this project
Posted Jan 2, 2026
Conducted a churn analysis to identify retention strategies for the telecom company.
Likes
1
Views
1