
main
Code
Go to file
Open more actions menu
Latest commit
Oct 16, 2026

Open commit detailssuccess
3af2268 · Oct 16, 2026
History
Open commit details
23 Commits
Folders and files
Name
Last commit message
Last commit date
Oct 16, 2026
Oct 16, 2026
Oct 16, 2026
Oct 16, 2026
Oct 16, 2026
Oct 16, 2026
Oct 16, 2026
Oct 16, 2026
Oct 16, 2026
Oct 16, 2026
Oct 16, 2026
Oct 16, 2026
Oct 16, 2026
Oct 16, 2026
View all files
Repository files navigation
Weather-Aware Truck Routing
A React + Django web app that helps a truck driver choose the safest route. It weighs the weather the truck will actually drive through, the load weight, and the travel time.
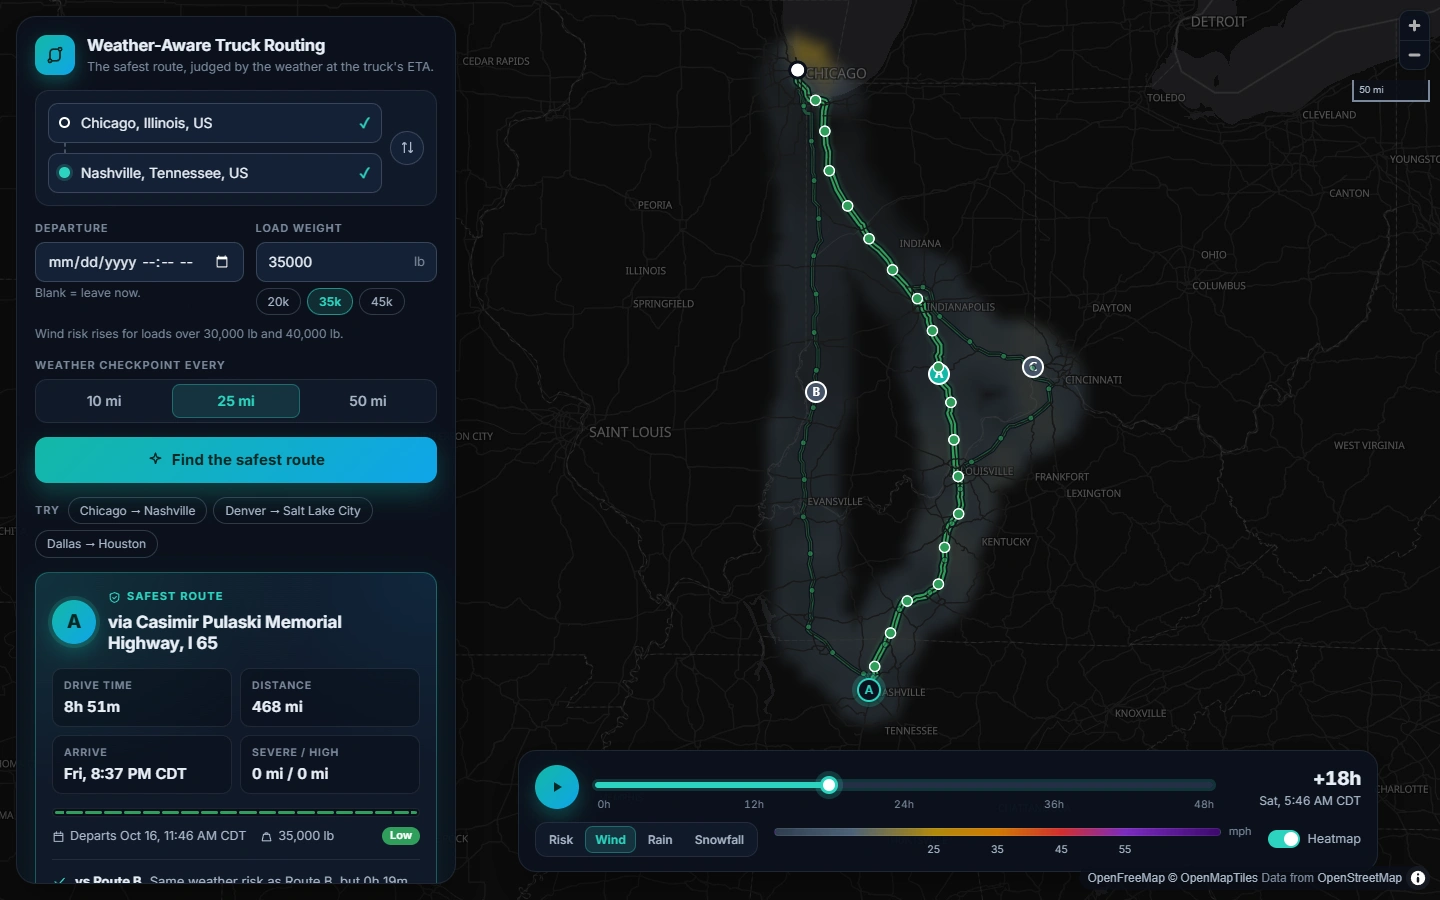
Enter an origin, a destination, a departure time and a load weight. The app returns three route options and checks the forecast at regular checkpoints along each one, at the time the truck is expected to reach each checkpoint. It scores the risk with the provided rules and recommends a route, explaining why it won. Everything is drawn on a map, with a corridor weather heatmap and a 0–48 h forecast slider.
Live demo: add the hosted URL after deploying (see Deployment)
Walkthrough video: add the Loom link (talking points: docs/WALKTHROUGH.md )
Features
Requirement
Implementation
Origin, destination, departure time, load weight
Address autocomplete. Departure is the wall-clock time at the origin (blank = leave now). Load is entered in lb, with presets.
3 route options from a routing API
OSRM alternatives, topped up with "via" detours when OSRM returns fewer than 3 (see below).
Sample weather every 10 / 25 / 50 miles at the truck's ETA
User-selectable interval. Each checkpoint's ETA comes from the router's per-segment drive times, and the forecast is read for that hour.
Risk from the risk/load rules
Pure, unit-tested rules engine with the boundary handling documented below.
Recommend the best route, balancing risk and time
Lexicographic ranking in the brief's order, with a plain-English reason for each comparison.
Routes, checkpoints, risk levels, ETAs and summaries on a map
Route lines colored by risk, checkpoint popups, route cards, and a checkpoint table linked to the map.
Weather heatmap along the corridor with a 0–48 h slider
Hourly forecast grid along the corridor, rendered on the client. The slider blends smoothly between hours, has playback and shows truck positions. Layers: risk / wind / rain / snow.
How it works
Loading
flowchart LR UI[React UI] -- POST /api/plan --> P[plan_trip] P --> TZ[Origin timezone<br/>Open-Meteo] P --> R[3 routes<br/>OSRM] R --> C[Checkpoints every N mi<br/>+ ETA per checkpoint] C --> W[Hourly forecast at each checkpoint<br/>Open-Meteo, cached] W --> K[Risk per checkpoint<br/>rules + load rules] K --> S[Per-route miles by level<br/>avg risk, time] S --> REC[Rank + explain] UI -- POST /api/heatmap --> H[Corridor grid<br/>49 hourly frames] H --> W
The plan endpoint returns first so routes appear immediately. The heatmap loads right after it and reuses the same forecast cache.
1. Routes
The app calls OSRM with alternatives=3 and asks for full geometry and per-segment distance/duration annotations.
OSRM often returns fewer than three routes. In that case it routes through via points offset to either side of the fastest route's midpoint. A candidate is kept only if it:
is at most 60% slower than the fastest route, and
does not overlap any kept route for more than 80% of its length (overlap is measured with a spatial hash at 250 m tolerance).
When a via point lands on a side road, the route goes out to it and comes back the same way. That out-and-back spur is detected and trimmed.
Truck speed cap: OSRM's public profile is for cars, so every segment is capped at 65 mph (TRUCK_MAX_SPEED_MPH). Segment durations are first rescaled so they add up to OSRM's total, which includes turn penalties.
Routes are labeled A/B/C, fastest first.
2. Checkpoints and ETAs
Checkpoints sit at mile 0, then every 10/25/50 miles, then at the destination.
Each checkpoint represents the stretch of road nearest to it: half the gap on either side. Per-level mileage therefore always adds up to the route length, and one bad checkpoint counts for about one interval.
ETA = departure + drive time to that point along the time-annotated track.
3. Weather at the ETA
Source: Open-Meteo hourly forecast, with units requested as mph and inches.
Wind: wind_speed_10m (sustained), interpolated linearly between the two hours around the ETA. Gusts are shown alongside. Set WIND_METRIC=gust to score gusts instead.
Rain: rain + showers. Snow: snowfall. Both are totals for the hour ending at each timestamp, so a 14:20 ETA uses the bucket stamped 15:00.
Locations are snapped to a 0.1° grid (≤ ~7 km), so nearby checkpoints share one forecast.
Each location is fetched once for a fixed 9-day window and cached for an hour. Changing the departure time or the load re-uses the cache and costs no new API calls.
4. Risk rules
Condition
Low
Moderate
High
Severe
No Travel
Wind (mph)
< 25
25 – < 35
35 – < 45
45 – < 55
≥ 55
Rain (in/hr)
< 0.10
0.10 – 0.25
0.25 – 0.50
0.50 – 1.00
1.00
Snow (in/hr)
< 0.5
0.5 – 1.0
1.0 – 2.0
2.0 – 3.0
3.0
Boundary convention. The brief's table repeats each boundary value in two columns (e.g. 0.25 appears under both Moderate and High). I resolved this from the endpoints it states explicitly:
Wind's top band is "≥ 55", so wind bands include their lower bound.
Rain and snow use "< 0.10" and "> 1.00", so their bands include their upper bound.
Every boundary has a test.
Load rules (escalate the wind level only):
≥ 55 mph → No Travel for any load (this is the table's top band)
45–54 mph and load > 30,000 lb → No Travel
35–44 mph and load > 40,000 lb → Severe
A checkpoint's level is the worst of wind, rain and snow. Each checkpoint records the reason for its level, e.g. "Wind 40 mph with 42,000 lb load (> 40,000 lb)".
5. Recommendation
Routes are compared one criterion at a time, in this order. A later criterion only decides between routes that tie on every earlier one.
Fewest No Travel miles (an addition: the brief's list doesn't mention No Travel, and a route with impassable stretches should never win)
Fewest Severe miles
Fewest High miles
Lowest average risk (distance-weighted mean of levels 0–4)
Shortest travel time
Mileage is compared to 0.1 mi and average risk to 0.01, so floating-point noise cannot decide a tie. The UI states the deciding criterion against each other route, e.g. "Fewer Severe miles than Route B: 0 mi vs 30 mi". It also warns when even the best route has Severe or No Travel miles.
6. Heatmap and slider
Backend: builds a lattice grid covering about 40 km around all routes. It picks the finest spacing (0.1°, 0.2°, …) that keeps the grid within about 220 locations, then returns 49 hourly frames (departure + 0…48 h) of wind, gust, rain, snow and load-aware risk.
Frontend: renders the grid into an image client-side:
bilinear interpolation, with rows re-projected to Web Mercator so the image lines up with the basemap;
opacity from each pixel's distance to the nearest route, computed once per heatmap, so the corridor is a smooth band along the roads;
each whole hour painted once and cached; in-between times cross-fade the two neighbouring hours, so scrubbing and playback are continuous and cheap.
The pixels are drawn into a MapLibre canvas source and copied into its texture in place: no PNG encoding, no network, no tile reloads.
Each slider tick costs about 2–3 ms of JS in the production build. Sidebar components are memoised, so only the map, the timeline and the current checkpoint row update.
The map library is a separate, lazily loaded chunk, so the form paints first.
Truck markers (lightweight DOM markers) on every route move with the slider. Hovering the map shows the value under the cursor.
API
Method
Path
Purpose
GET
/api/health/
Liveness check
GET
/api/geocode/?q=nashville
Place search (Photon / OpenStreetMap)
POST
/api/plan/
Routes, checkpoints, risk and recommendation
POST
/api/heatmap/
Corridor forecast grid for the slider
// POST /api/plan/ { "origin": { "lat": 41.8781, "lon": -87.6298, "label": "Chicago, IL" }, "destination": { "lat": 36.1627, "lon": -86.7816, "label": "Nashville, TN" }, "departure": "2026-10-17T06:00", // origin-local; omit/null = now; "...Z" = absolute "load_weight_lb": 42000, "interval_miles": 25 // 10 | 25 | 50 }
The response contains trip (resolved UTC departure and origin timezone), recommendation (route id, comparisons, warnings) and routes[]. Each route carries its stats, a simplified path with drive time at each vertex (path_times_s), and checkpoints[]. Each checkpoint has its mile, ETA, weather, per-condition levels and reasons.
Errors always come back as JSON: field validation → 400 {field: [msg]}, invalid trip → 400 {detail, code}, upstream API failure → 502 {detail, code}.
Running locally
Prerequisites: Python 3.12+ and Node 22+. No API keys are needed: every provider is free and keyless.
Backend (http://127.0.0.1:8000) cd backend python -m venv .venv .venv/Scripts/activate # Windows; use source .venv/bin/activate on macOS/Linux pip install -r requirements-dev.txt cp .env.example .env # sets DJANGO_DEBUG=1 python manage.py runserver # Frontend (http://localhost:5173, proxies /api to the backend) cd frontend npm install npm run dev
source .venv/bin/activate on macOS/Linux pip install -r requirements-dev.txt cp .env.example .env # sets DJANGO_DEBUG=1 python manage.py runserver # Frontend (http://localhost:5173, proxies /api to the backend) cd frontend npm install npm run devConfiguration is read from environment variables (see backend/.env.example):
Variable
Default
Purpose
DJANGO_DEBUG
0
Debug mode
DJANGO_SECRET_KEY
dev key
Set in production
DJANGO_ALLOWED_HOSTS
localhost,127.0.0.1
Comma-separated
TRUCK_MAX_SPEED_MPH
65
Per-segment truck speed cap
WIND_METRIC
sustained
sustained or gust
HEATMAP_MAX_CELLS
220
Weather-location budget for the heatmap
HTTP_FORCE_IPV4
0
Workaround for networks whose IPv6 path stalls TLS
OSRM_BASE_URL, PHOTON_BASE_URL, OPEN_METEO_BASE_URL
public instances
Point at self-hosted services
VITE_API_BASE_URL (frontend build)
same origin
API origin if the frontend is hosted separately
Tests and quality
cd backend && ruff check . && ruff format --check . && pytest # 108 tests cd frontend && npm run lint && npm run typecheck && npm test # 15 tests
Backend tests cover:
every risk boundary and load rule;
checkpoint placement and ETAs;
ranking and its explanations;
spur trimming and via-route selection;
forecast time alignment, batching and caching;
the full API, with deterministic fake providers.
Frontend tests cover the heatmap renderer (projection, interpolation, gaps, blending) and the route geometry and time math.
CI (.github/workflows/ci.yml) runs all of the above, builds the Docker image and smoke-tests it.
Performance
docs/PERFORMANCE.md has the full report and perf/ has the scripts. Measured on a 2013 dual-core with software-only WebGL, so these are worst-case numbers:
Metric
Result
First plan
~6 s, dominated by OSRM and the weather API
Re-plan with a new load or departure
35–200 ms, from cache, with no upstream calls
Slider
~2–3 ms of JS per tick
Playback
~10 fps on this PC, limited by software rasterisation (the main thread is ~50% idle); memory stays flat
JS on first load
80 KB gzipped app code; the map library loads in parallel
Deployment
Vercel (Services). vercel.json defines two services in one project, on one domain:
Service
Root
Public path
What it is
frontend
frontend/
everything except /api/
Vite build, served from Vercel's CDN
backend
backend/
/api/(.*)
Django as a Vercel Function; receives the full /api/... path
The browser calls the API with relative /api/... URLs, and the backend only calls third-party APIs, so the services don't call each other and need no bindings.
To deploy: Add New → Project → import the repo. Then in Settings → Environment Variables, set DJANGO_SECRET_KEY. Hosts under *.vercel.app and the production domain are allowed automatically; add any other custom domain to DJANGO_ALLOWED_HOSTS.
Caveat: each function instance has its own in-memory cache, so cached routes and forecasts are shared only within a warm instance.
Docker (Render or any container host). The Dockerfile builds the React app and serves it from Django, so there is one service, one URL and no CORS:
Static assets are served by WhiteNoise, pre-gzipped, with immutable caching.
The API runs on gunicorn with threads, because the work is I/O-bound.
Render (free): New → Blueprint → select this repo. render.yaml configures the service. Free instances sleep when idle, so the first request after a pause takes about 30–60 s.
Any Docker host:
docker build -t weather-truck-routing . docker run -p 8000:8000 -e DJANGO_ALLOWED_HOSTS=localhost -e DJANGO_SECRET_KEY=change-me weather-truck-routing
Project structure
backend/ config/ Django settings (env-driven), URLs, WSGI planner/ domain/ Pure logic, no I/O: risk.py, geo.py, checkpoints.py, recommendation.py, corridor.py providers/ OSRM, Photon, Open-Meteo clients + shared HTTP session services/ Use cases: trip.py (plan), heatmap.py api/ DRF serializers, views, error handling tests/ frontend/src/ api/ Typed client + API types components/ Form, place autocomplete, route cards, checkpoint table, timeline hooks/ usePlan, useHeatmap, usePlayback map/ MapView (MapLibre), heatmapRenderer, color scales lib/ Route/time math, formatting
Assumptions and limitations
Car routing, truck speeds. OSRM's public server only has a car profile, so it doesn't know about low bridges, truck-restricted roads or hazmat rules. Speeds are capped at 65 mph. A truck-aware router such as HERE or ORS driving-hgv would slot in behind the same fetch_route_options interface.
No hours-of-service breaks. ETAs assume continuous driving. Adding HOS rest stops would shift the ETAs of long trips.
Forecast horizon. Departures can be up to 7 days ahead (or 6 h in the past). Checkpoints beyond the forecast count as "No forecast" miles and are flagged.
Free API quotas. Open-Meteo allows 600 locations per minute. Snapping, caching and the heatmap budget keep a typical trip under ~300. The in-process cache assumes one instance; scaling out would mean moving it to Redis.
Units. US units throughout (mph, in/hr, lb, miles), matching the brief.
About
React + Django app that picks the safest truck route by weather, load weight and travel time.
Resources
Readme
Stars
0 stars
Watchers
0 watching
Forks
No releases published
Contributors 2 (2)


Languages
You can’t perform that action at this time.
1 like · 4 views · Nov 3, 2026
React + Django web app that recommends the safest truck route by scoring weather, load weight, and travel time.