Smart City Data Analytics Dashboard
Tash Canter
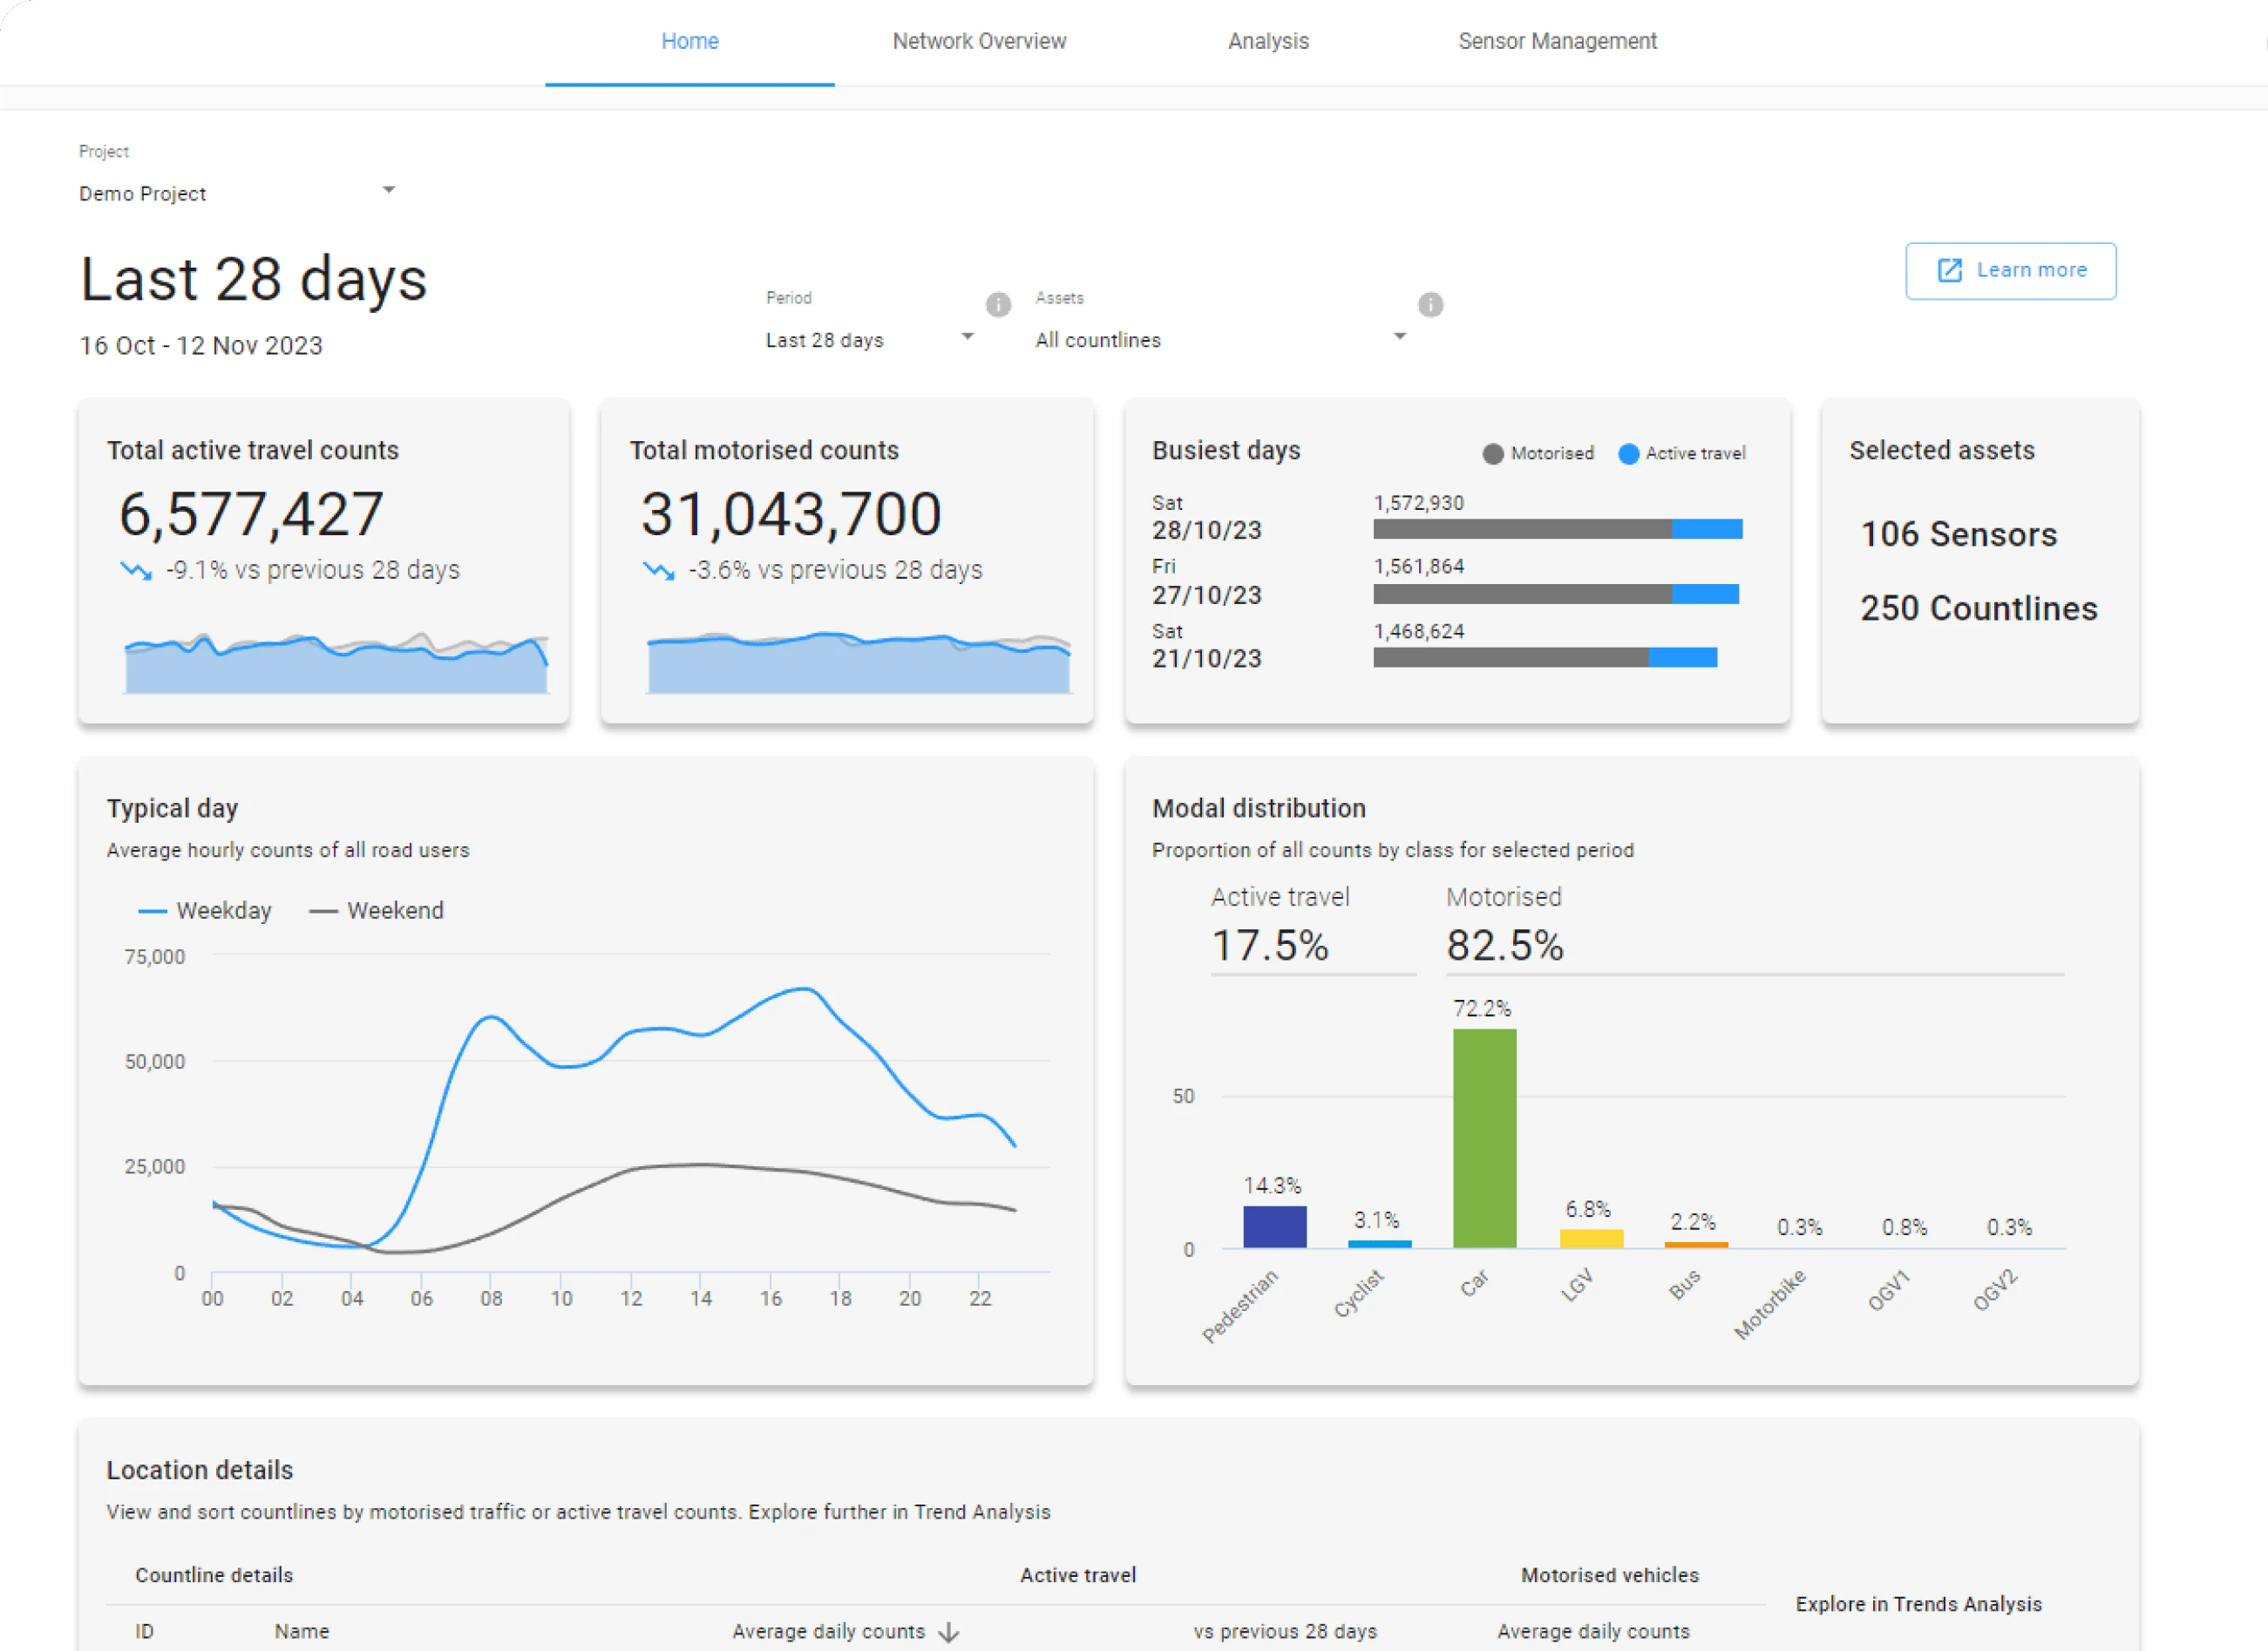
I helped build a smart city analytics dashboard used by clients like TfL to visualise real-time traffic insights from sensor networks across cities in the UK, Australia, and the US.
What I did:
Developed a new dashboard homepage with interactive Highcharts data visualisations, using React + TypeScript on the frontend
Designed and deployed Golang API handlers and SQL pipelines to query and format sensor data from TimescaleDB, replacing older Grafana panels
Solved complex time zone issues to ensure accurate graphing and aggregations across global deployments
Collaborated in product planning, translated Figma designs into production UI, and helped select data panels
Improved performance using custom React hooks and fine-grained iframe messaging
Contributed to frontend and backend deployment via Kubernetes
This dashboard upgrade boosted engagement by improving speed, accuracy, and usability of insights. I enjoyed owning both backend and frontend integration, working closely with product, and solving deep technical problems.
Like this project
Posted Dec 18, 2024
Built an analytics dashboard with React, Highcharts, and Golang, optimising data access with TimescaleDB and solving timezone challenges.