
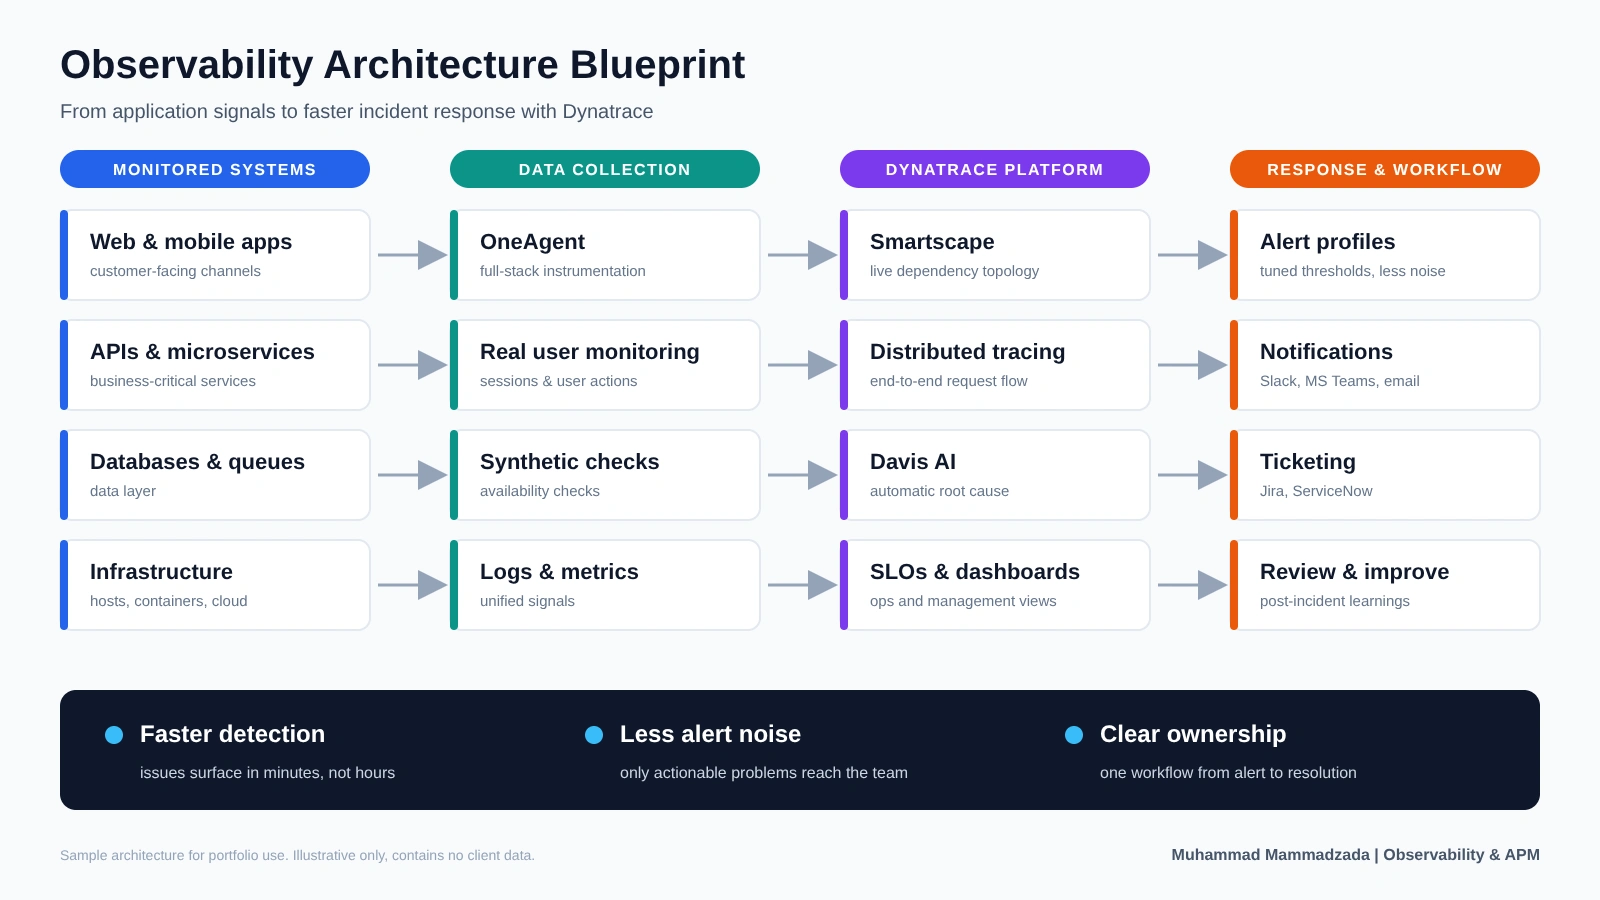
A sample observability architecture I designed to show how a team can go from raw application signals to faster incident response using Dynatrace.
The challenge: Growing teams often have logs, metrics and traces scattered across tools, so finding the root cause of a production issue takes too long and alerts become noise.
What I did:
Mapped the full flow: monitored systems → data collection → Dynatrace platform → alerting and workflow
Covered APM, real user monitoring, synthetic checks, distributed tracing and logs in one view
Defined how alerts reach the right people through Slack/Teams and Jira/ServiceNow
Planned SLO dashboards for both operations and management
Tools: Dynatrace, Smartscape, Davis AI, Jira, ServiceNow
This is a generic blueprint with no client data. I can adapt it to your stack and run a short audit of your current monitoring setup.
0 likes · 0 views · Oct 23, 2026
A sample observability architecture I designed to show how a team can go from raw application signals to faster incident response using Dynatrace. The challe...

