Retail Sales Analysis Project
Ifenna Daniel
Objective
This report analyzes the weekly sales of over 45 stores to uncover trends, evaluate the impact of markdowns and holidays on weekly sales.
Business Questions
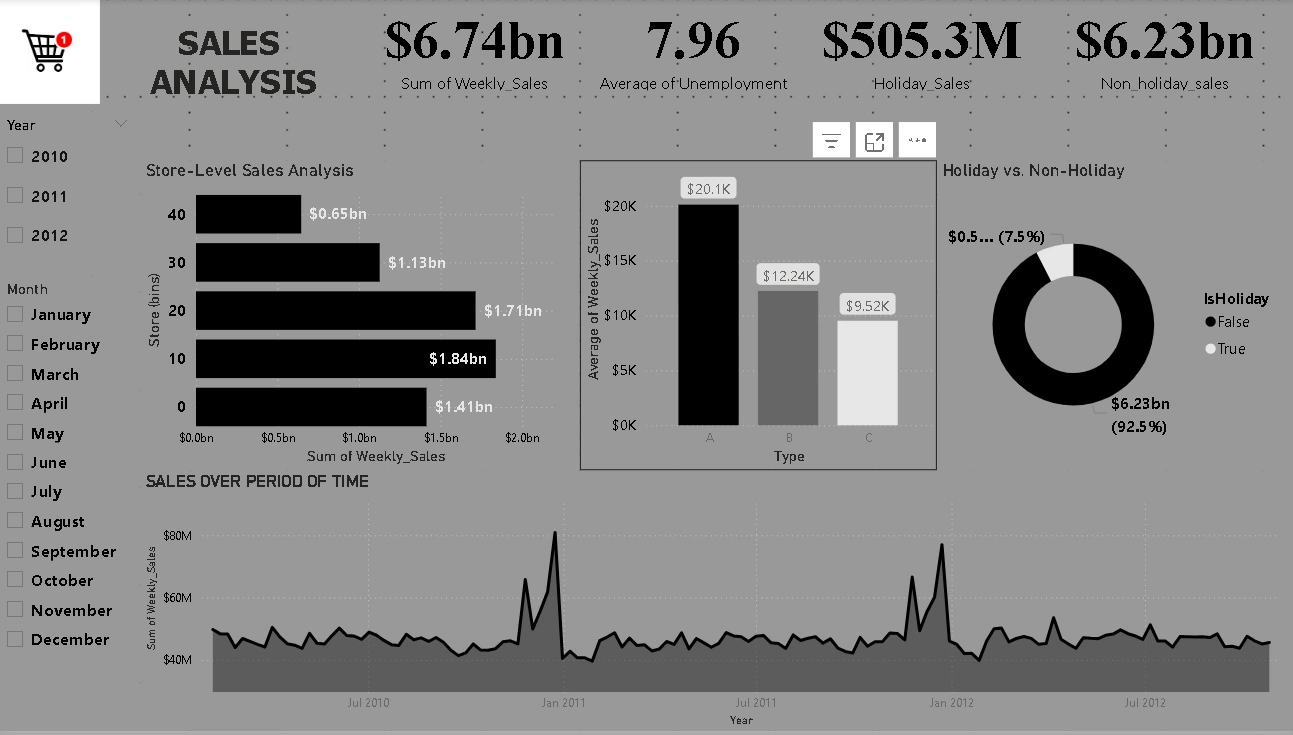
1. What is the overall trend in sales over time? The analysis revealed a seasonal pattern in sales, with noticeable spikes during the holiday such as the Christmas period. However, a noticeable gradual decline occurs after the 1st Quarter of the year.
2. Identify stores with the highest and lowest sales. The store with the highest sales is store 20 with a total sales of $301,397,79,,2 and the store with the lowest sales is 33 with a total sum of $37,160,222.
3. How do economic factors(CPI, Unemployment, Fuel Price, Temperature) influence sales?
CPI and Unemployment are negatively correlated but have a weak significance in impact on sales. meaning that the increase in either economic factor leads to a slight decline in weekly sales
Fuel price is also negatively correlated, but doesn’t have a strong significance in the outcome of sales. However, Temperature has a positive impact on the impact of sales. For example, stores sell more sunglasses during summer and more winter coats during winter.
4. How do markdowns affect weekly sales? Markdowns positively influence weekly sales. First of all, in our analysis, we calculated the mean value for all markdowns based on the holiday period represented as False and the Non-Holiday period represented as True. It was discovered that Markdown 2 and Markdown 3 have the highest mean value during Non-Holiday sales, as Markdown 1 and Markdown 5 have stronger mean values during the holidays. A linear regression model was built to test the correlation of each markdown to weekly sales; all have a slight positive relationship, as all correlations are less than 0.1.
5. Sales during the Holiday vs sales during Non-Holiday. The sum of weekly sales across all stores during the holiday is $505.3 million, and during Non-Holiday, $6.23 billion
Recommendation
Strategic markdowns can boost sales significantly, especially near holidays. External economic indicators alone are not strong predictors, but they add context.
Sales Forecasting Dashboard
Dashboard Preview
Key Features
Weekly Sales Trends – Track overall and department-level sales patterns over time.
Store Performance – Compare weekly sales across various stores.
Holiday Impact – Visualize the difference in sales during holiday and non-holiday weeks.
Markdown Analysis – Explore how price discounts influence weekly sales.
Trend Breakdown – Interactive visuals to identify drops and spikes in revenue.
Download Dashboard File
Like this project
Posted May 21, 2025
Analyzed weekly sales of 45+ stores to uncover trends and evaluate markdowns and holidays impact.
Likes
0
Views
8
Timeline
Mar 4, 2025 - May 6, 2025
Clients
Freelance