YOU SHOULDN'T HAVE TO SPEND

ADEKANYE DAMILARE


YOU SHOULDN'T HAVE TO SPEND HOURS COLLECTING DATA JUST TO UNDERSTAND YOUR BUSINESS PERFORMANCE.
Many businesses collect information from different sources.
For example:
Sales records are stored in one application.
Customer information is stored in a CRM.
Expenses are tracked in spreadsheets.
Website performance is monitored separately.
The challenge is bringing all this information together.
This is where automated reporting becomes useful.
Imagine this workflow:
Your sales platform records new transactions.
Your expense spreadsheet receives updated information.
Your CRM tracks customer activity.
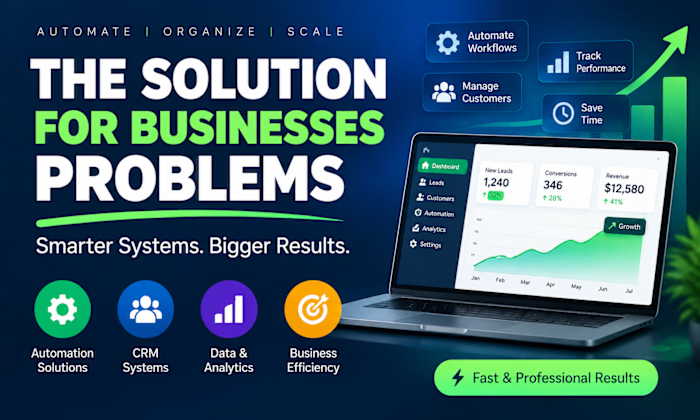
Data is connected to a reporting dashboard.
Your dashboard displays updated business information.
Instead of manually compiling different reports every time, you can create a system that organizes important information in one place.
What can an automated dashboard help you monitor?
📊 Sales performance.
📊 Customer acquisition.
📊 Business expenses.
📊 Lead conversion.
📊 Team productivity.
Tools such as Google Sheets, Excel, Power BI, and automation platforms can help create connected reporting systems.
Remember: Data is valuable, but organized and accessible data is even more useful when making business decisions.
What business metric would you most like to monitor from one dashboard?
#DataAutomation #BusinessAutomation
Like this project
Posted Nov 3, 2026
YOU SHOULDN'T HAVE TO SPEND HOURS COLLECTING DATA JUST TO UNDERSTAND YOUR BUSINESS PERFORMANCE. Many businesses collect information from different sources. F...
Likes
0
Views
0