Advanced Cost Analyzer

Nikhil Singh


Advanced Cost Analyzer
Transparency for CFOs, Precision for CTOs
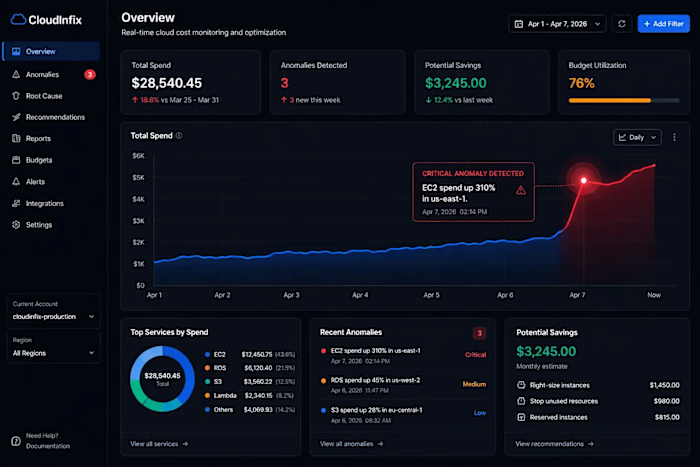
CloudInfix transforms cryptic AWS line items into a clear, visual narrative. We move past simple reporting into Unit Economics and Sustainability.
Contact Us
Book a Demo

Advanced Cost Analyzer
OverviewUnit EconomicsSustainability
TOTAL CLOUD SPEND
$12,832/month+18%
vs. previous period
ENGINEERING AWS ACCOUNTSCOST/USERTOTAL COSTUNIT COST
W21-101_900-6366$117.42$3,128$17.42
E34-204_500-1197$98.15$2,840$14.20
M18-302_750-4431$76.33$4,210$21.05
Carbon Footprint Index (CFI)
1.42kgCO2e/USER+24%
Significant reduction in footprint detected due to storage compression protocols across Frankfurt nodes.
COST PER USER
$15.88/user
Multi-Account Visibility
$12,832+18%
Aggregated spend from 9 cloud accounts
Engineering$6,420
Sales$2,491
Marketing$1,058
COST EFFICIENCY INDEX
83+15%
905
Active Usage Units
the problem
The "Black Box" of Cloud Spending
Native billing tools are built for accounting, not for engineering or business strategy.
Data Latency
You only see costs after the damage is done. By the time reports arrive, the spike has already hit your bill.
The Tagging Nightmare
Your cost data is fragmented and unreliable. Untagged and inconsistent resources make accurate attribution impossible.
Lack of Context
A $5,000 spike means nothing without context. Was it a deployment, a scaling event, or a mistake? You’re left guessing.
Carbon Footprint Index (CFI)
Measure environmental impact alongside cost.
CARBON & COST TRENDS
Emission Intensity vs Expenditure (30d)
CARBONCOST
87.9kg CO₂e
Carbon Rates
1,240 kg/day
EMISSIONS BY SERVICE
EC2 Compute40.2%
S3 Storage32.8%
VPC Networking13.5%
& More13.5%
08 MAY15 MAY22 MAY
OPTIMIZATION RECOMMENDATIONS15.3% POSSIBLE REDUCTION
HIGH
Consider migrating to a lower-carbon region
EU-Central 1 recommended over US-East 1
MED
Optimize EC2 Compute Instances
Right-size underutilized compute resources
MED
Enable AWS Customer Carbon Footprint Tool
Activate emission reporting and alerts
Track the carbon footprint of your AWS infrastructure in real time with service-level granularity
Align cloud usage with ESG and sustainability goals using measurable, report-ready data
Identify high-emission services and workloads that contribute most to environmental impact
Directly link cost optimization → carbon reduction to drive both financial and sustainability outcomes
Cost-per-Service Metrics
Understand your true unit economics
COST PER SERVICE
$0.27+9%
VS LAST MONTH ($0.24)
56%
Cost Explorer
Direct infrastructure attribution
DAILY API REQUESTS
1.2M
VIEW DETAILED REPORT ›
Service BreakdownLIVE FEED
Elastic Compute Cloud
Instance usage & monitoring
$0.0042
per request
EC2 - Other
Component of usage
$0.0018
per request
Relational Database
Database service usage
$0.0009
per request
Calculate cost per customer, feature, or transaction with precise cost allocation models
Identify high-cost users and inefficient services impacting your margins
Optimize pricing strategies and improve profitability using real usage data
Directly link service-level costs to business outcomes for smarter budget decisions
AI-Powered Diagnostics
Root Cause Cost Analysis
One unified financial view.
Cost Over Time● LIVE
$600$400$200$100$0
+42% Increase$443/hr16:00 UTC
OPTIMIZATION SCORE84.2%
Diagnostics
TRIGGER EVENTTraffic Spike DetectedSudden 340% increase in EC2 request volume at 16:00 UTC
PRIMARY CHANGEAuto-Scaling Activation22 new instances launched across us-east-1 and eu-west-1
OBSERVED OUTCOMECost Spike +42%Hourly cost rose from $312 to $443 — exceeding budget threshold
3Events Detected
+42%Cost Increase
AutoResolution
Pinpoint Cost Anomalies Instantly
AI-driven detection highlights the exact service, time, and root event behind every cost spike.
Correlate Events to Cost Spikes
Link infrastructure changes, deployments, and traffic surges directly to billing line items.
Drill Down to Service Level
Break down spikes across EC2, RDS, Lambda, and 150+ AWS services with per-resource granularity.
Prevent Future Overruns
Automated alerts and threshold guardrails ensure anomalies are caught before they compound.
How It Works
From Raw Cloud Data to Actionable Insights
A simple, automated pipeline that transforms complex AWS billing into clear, real-time decisions.

INGEST
Connect your cloud data
Securely connect AWS accounts and start streaming real-time billing and usage data across all services.
STORAGETRAFFIC
NORMALIZE
Structure and organize data
Clean and organize raw cost data, applying tags to map spending across teams, services, and environments.
NODE_ANALYTICS_V0.3
LATENCY: 0.042ms
LATENCY12ms ↘
THROUGHPUT8.4gb/s
ERRORS0.00%
ANALYZE
Generate insights instantly
Break down cloud costs to uncover trends, identify cost drivers, and gain clear, actionable insights.
SYSTEM EFFICIENCY+24.8%
STABLE
OPTIMIZED STATE
OPTIMIZE
Take action and reduce waste
Detect inefficiencies, eliminate waste, and optimize cloud spend with data-driven recommendations.
"VK Digitals is a results-oriented digital marketing platform dedicated to elevating brand presence through strategic online engagement and innovative growth solutions."
Vansh Aggarwal
FOUNDER
Stop analyzing. Start understanding.
Turn complex cloud costs into clear insights and take action with confidence.
Book a Demo
Like this project
Posted Oct 28, 2026
Transforms AWS billing into unit economics and sustainability metrics with AI-powered diagnostics and root-cause cost analysis.
Likes
0
Views
0
Tags