Signal: Decision-Intelligence Engine for Restaurant Operations

Jayme Volstad


Signal Operations Intelligence

Landing Page for Pilot Product
Restaurant operators don’t need more reports. They need help knowing what to fix first.
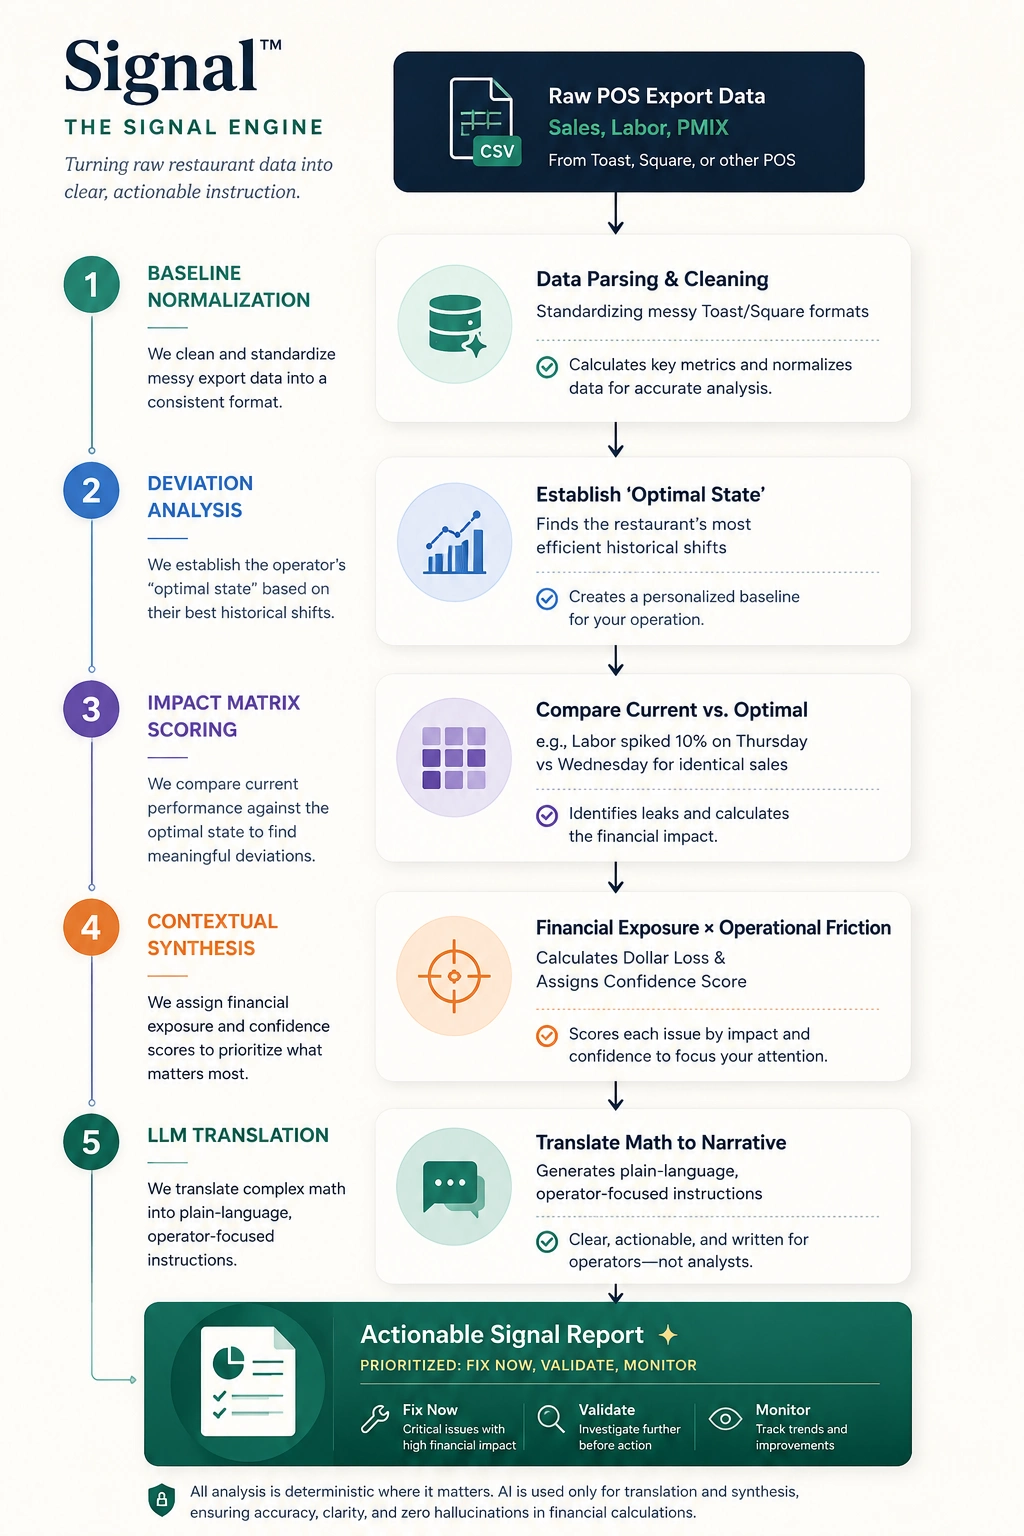
Signal was built to solve that problem. It ingests inconsistent operational data, normalizes it into a common schema, validates quality, evaluates risk, and surfaces the highest-impact decisions with transparent reasoning and confidence scoring.
Disclaimer: This repository demonstrates architecture, evaluation methodology, and data normalization concepts. Production scoring models and commercial rule sets are intentionally simplified for portfolio purposes.
The Core Concept
Signal is a decision-intelligence engine that solves the "dashboard fatigue" common in multi-unit restaurant operations. By normalizing disparate reports (Point of Sale sales mix, payroll clock-ins, cash audits) into a unified operational schema, it runs deterministic evaluations to flag margin leaks, schedule compliance gaps, and cash risk.
The underlying architecture is built to ingest inconsistent inputs, evaluate risk based on confidence and severity metrics, and produce auditable decision support.
Why Signal Exists
Years of working in high-pressure operations taught me that organizations rarely fail because they lack data—they fail because they can't consistently interpret it. Signal was built to explore how deterministic evaluation frameworks can bridge that gap by making decisions more transparent, auditable, and actionable.
By demonstrating how to normalize inconsistent inputs, validate quality, and surface explainable insights, the framework models how we can scale decision support across high-stakes SaaS domains—including POS system integrations, labor optimization, and automated cash auditing.
Lessons from Building Signal
Data quality problems are often more important than business logic quality. If the source POS data is corrupted, duplicate, or misaligned, even the most advanced scheduling rule will yield flawed recommendations.
Confidence should be communicated alongside every recommendation. An operator must know not just what the system suggests, but how complete and stable the underlying timecard or sales evidence is.
Explainability is a feature, not an afterthought. If a store manager cannot audit the mathematical formulas and triggered thresholds behind a labor variance, they will not trust the system to alter schedules.
Humans make better decisions when ambiguity is structured rather than hidden. Hiding operational complexities behind flat color status indicators degrades decision quality.
Systems should accelerate judgment, not replace it. The framework's role is to present evidence and suggest action protocols, leaving final executive discretion to the general manager.
Design Principles
Deterministic over opaque: Hard-coded math, clear thresholds, and reproducible calculations replace "black box" machine learning or opaque heuristics for auditability.
Explainable over black-box: Every diagnostic insight links directly back to the raw records and parameters that triggered it, complete with mathematical formulas and step-by-step evidence.
Human-auditable outputs: Decision support recommendations and metrics are designed to be read, verified, and exported by human operators, preserving trust.
Confidence-aware recommendations: Each decision support entry includes a confidence grading score based on data completeness and signal stability.
Data quality before decision quality: Checking schemas, bounding numeric outliers, and resolving duplicate records occurs before evaluating operational health.
System Architecture
An Actual Example
1. Raw Input
Messy, raw CSV records (e.g. from Toast POS timecards) are uploaded to the client sandbox:
2. Normalized Output
The ingestion normalizer maps keys, cleans values, bounds anomalies, and creates structured telemetry:
3. Priority Decision Support
A deterministic grading module compares the telemetry against regional standards and active parameters:
[Rule-14] Labor utilization is significantly below expected efficiency. Projected annual margin leakage: $38,000. Confidence: High.
System Interface Preview
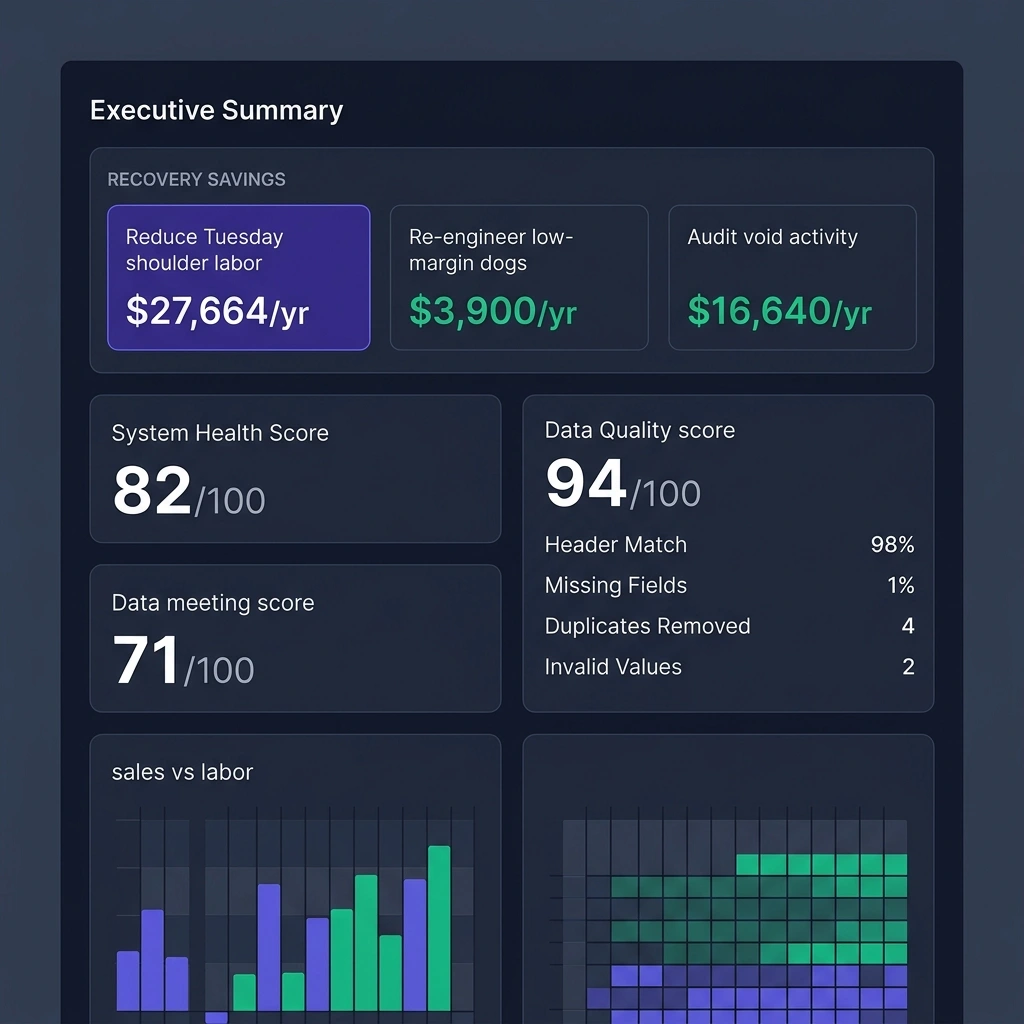
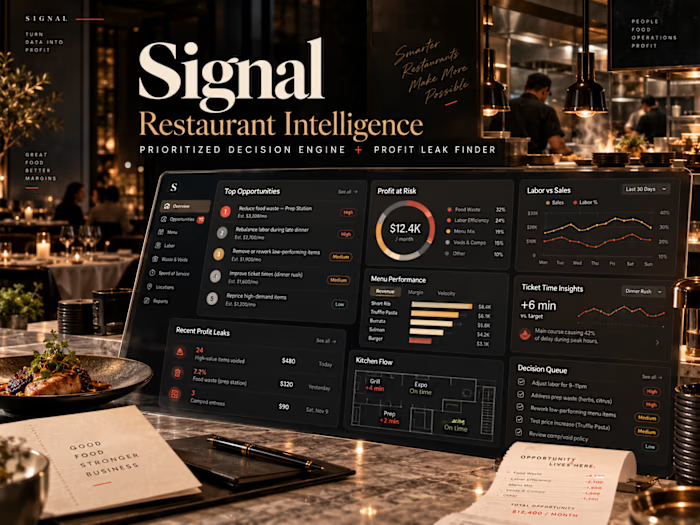
Figure 1: Signal Interactive Operations Dashboard (System health score, data quality validation, and prioritized decision support findings).
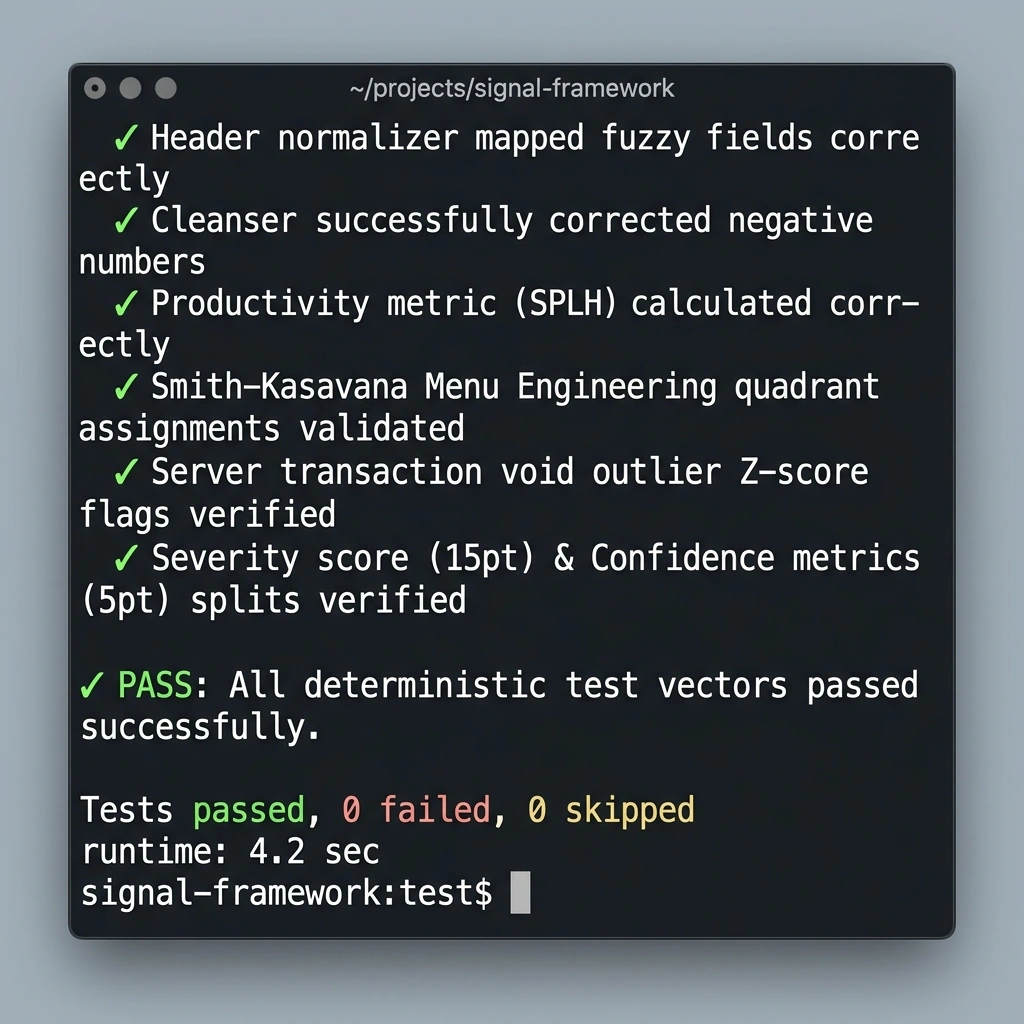
Figure 2: Built-in deterministic test runner demonstrating 100% assertions pass rate on incoming sample vectors.
Quick Start: Try the Demo
Clone the Repository:
Run Locally: Simply double-click
index.html to open the application in any modern web browser. Since it operates entirely client-side, no local server or installations are required.Load a Preset Profile: Use the Client Presets buttons at the top right (e.g. Bistro Royale, Urban Slice, Morning Grind, Campus Cafe) to instantly load pre-populated datasets and trigger the complete analysis.
Trigger Custom Audits: Navigate to the Pipeline Control & Logs tab to view the raw CSV structures, load raw CSV logs, map custom columns with the Normalization Wizard, or trigger a manual ingestion cycle.
Portfolio Purpose
Signal is a systems-building portfolio project designed to demonstrate data normalization, quality checks, deterministic diagnostic logic, anomaly scoring, and actionable decision support design.
The goal is not to present a flashy restaurant dashboard. The goal is to show how messy operational data can be converted into structured, auditable insights using clear rules, documented assumptions, and repeatable evaluation workflows.
What Recruiters Should Notice
Data Quality Engineering over Business Heuristics: The core focus is on the data pipeline. It evaluates the validity and consistency of the data itself (using deduplication, absolute-value bounding for negative hours, and average interpolation for missing cells) before executing business rules.
Granular Grader Rubrics: Rather than flat anomaly flags, decision support findings are graded on two separate dimensions: a 15-point Severity scale (measuring financial impact, risk, and frequency) and a 5-point Confidence checklist (confirming completeness, pattern stability, and timestamp alignment).
Statistical Outlier Detection (Z-Score): The void logs audit evaluates cashiers using standard deviations ($z \ge 1.5$) against active shift averages. This prevents global check errors from falsely triggering anomalies on individual cashiers.
Verifiable Mathematical Logic: The calculations are completely transparent. Every finding includes an "Explain this Finding" drawer displaying the math behind the deviation, the specific baseline and threshold triggers, and the list of triggered rules.
Deterministic Unit Tests: The mathematical calculations (Smith-Kasavana menu categories, SPLH, Z-scores, and grading metrics) are fully verified on launch with a local test suite visible in the Test Vectors Suite tab.
Why This Architecture Matters for Enterprise Restaurant SaaS
Signal demonstrates the same core skills required to build data-quality pipelines and analytics modules for enterprise restaurant ERPs: turning messy, unstructured POS exports into structured outputs, defining consistent evaluation criteria, and documenting decision logic.
Restaurant SaaS Challenge Signal Implementation Parallel Source Reference POS Schema Drift Heuristic column normalizer that maps varying POS formats (Toast, Clover, Aloha) to standard schema keys parsers.js Ambiguous Headers Override Halts ingestion on unmatched headers and prompts manual resolution via Mapping UI wizard parsers.js Ingestion Quality Audits Waterfall progress checklist auditing parsing, deduplication, range validity, and diagnostics app.js Deterministic KPI Grading Implements standard metrics formulas (SPLH, COGS, Prime Cost, contribution margin) diagnostics.js Severity Scoring Heuristics Multi-dimensional scoring framework: $S = \text{Financial} (1-5) + \text{Frequency} (1-5) + \text{Ops Risk} (1-5)$ evaluation.js Decision Confidence Metrics Evaluator confidence rating: $C = \frac{\text{Completeness} + \text{Stability} + \text{Quality}}{3}$ evaluation.js Operator Audit Logs "Explain this Finding" drawer displaying rules triggered and observed vs baseline margins app.js
Data Ingestion & Transformation Pipeline
The ingestion engine converts raw, inconsistent CSV files into structured JSON schemas, correcting negative numbers and interpolating missing costs.
Export Options
Signal supports multi-format report exports for stakeholders:
Print / Save as PDF: Toggling the Print / Save as PDF button applies custom CSS media queries (
@media print) that strip out navigation tabs, log consoles, and buttons, formatting the dashboard into a clean, document-styled executive report.Export Audit JSON: Exports the complete processed telemetry state (including normalized logs, KPIs, recommendations, and Z-score calculations) as a standardized JSON data file.
Export Findings MD: Compiles finding cards, mathematical evidence, and action protocols into a formatted Markdown document suitable for integration into external dashboards or wikis.
Ingest Testing Vectors
Signal incorporates a deterministic assertions suite running both in Node.js and directly in the browser UI under the Test Vectors Suite tab.
Parser Test: Validates header mapping heuristics, deduplication filters, and missing data interpolations.
Diagnostics Test: Asserts SPLH averages, Prime Cost ratios, Smith-Kasavana menu classifications, and Z-score server void deviations.
Evaluation Test: Asserts Severity (15pt), Grader Confidence (5pt), and System Health Score formulas.
To run tests in CLI:
Future Roadmap
Multi-POS adapters: Standardize ingestion adapters for major systems like Toast, Clover, and NCR Silver.
LLM-assisted explanation layer: Integrate a local LLM interface to draft operator action protocols based on the deterministic findings.
Historical trend engine: Run time-series regressions on rolling monthly data to detect multi-week operational drift.
Predictive staffing: Use historical volume patterns and forecast schedules to recommend dynamic staffing guidelines.
Anomaly clustering: Apply density-based spatial clustering to group related void and labor deviations.
Benchmark comparisons: Integrate industry-standard regional performance benchmarks to contextualize store performance.
Project Structure
Signal Philosophy
The goal of Signal is not to automate judgment, but to make human judgment faster, more consistent, and easier to defend by transforming ambiguous operational data into structured evidence.
Like this project
Posted Aug 29, 2026
Developed Signal, a decision-intelligence engine for restaurant operations data.