Built with Retool
Sales, Refunds, and Chargebacks Monitoring Dashboard
Retoolers .io
Project Title:
Sales, Refunds, and Chargebacks Monitoring Dashboard
Project Description:
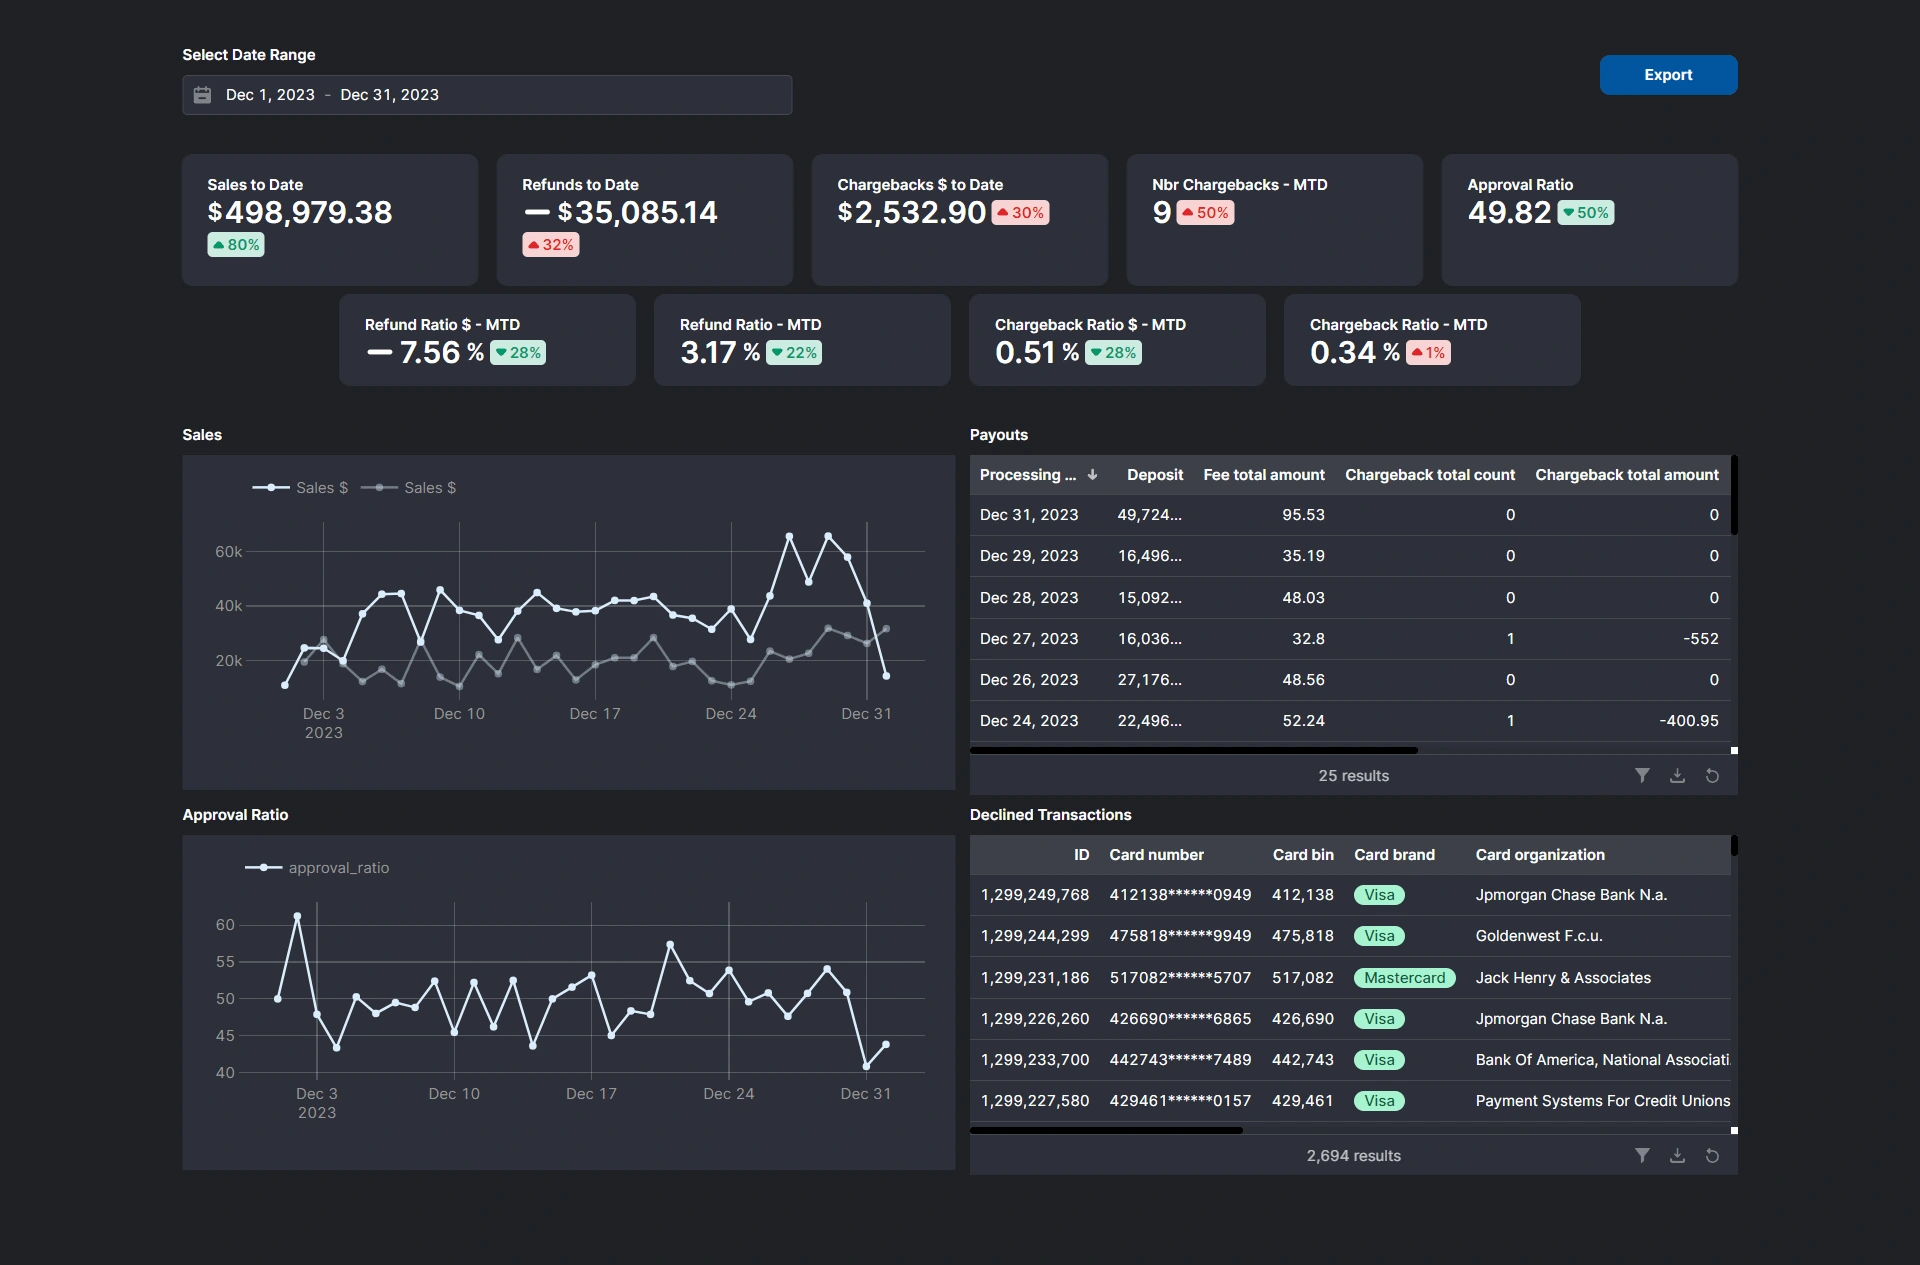
This is a Financial Monitoring Dashboard built using Retool, designed to give companies real-time visibility into their sales performance, refund activity, chargeback rates, and approval ratios over a selected period.
Key Features:
Date Range Filtering:
Users can select any custom date range to view the metrics dynamically.
Key Financial Metrics Overview:
Sales to Date: Total revenue generated within the selected period.
Refunds to Date: Total refunded amount, with percentage changes highlighted.
Chargebacks to Date: Amount and number of chargebacks with red flags for increases.
Approval Ratio: Percentage of transactions successfully processed without declines.
Detailed Performance Ratios:
Refund Ratio (Month-to-Date): Refunds relative to sales, tracked and trendlined.
Chargeback Ratio (Month-to-Date): Monitors chargeback activity and highlights trends.
Dynamic Data Visualizations:
Sales Trend Graph: Visualizes daily sales revenue across the selected period.
Approval Ratio Trend Graph: Shows fluctuations in approval rates, helping to diagnose transaction issues.
Transaction and Payout Tables:
Payouts Table: Displays daily deposit amounts, associated fees, and chargeback information.
Declined Transactions Table:
Lists declined transactions with card details (masked), card brands, card bins, and issuing bank names.
Enables operational teams to quickly spot and analyze decline patterns (e.g., by card type, issuer).
Data Export:
One-click "Export" button to download filtered data for external reporting or deeper analysis.
Technology Stack:
Frontend: Retool
Backend: Retool queries, database (likely Postgres or BigQuery), payment gateway APIs.
Use Cases:
Daily financial monitoring by Finance and Operations teams.
Early detection of rising refund or chargeback issues to prevent revenue loss.
Analyzing approval ratios to optimize payment processing performance.
Investigating declined transactions for potential fraud detection or card processing improvements.
Like this project
Posted Apr 27, 2025
Built a financial monitoring dashboard using Retool for real-time sales and refund insights.