Human Value Index: Visualizing Media Bias

Asif Farhan Khan


Human Value Index
Client Overview
Steven is a practicing artist and social entrepreneur. For the Human Value Index project, Steven envisioned an art installation that would challenge audiences to confront the imbalance in how violent deaths are valued and represented in mainstream Western media. He wanted to move beyond abstract statistics and build a live, evolving system that visually highlights the disparity between global conflict-related deaths and the amount of media attention they receive.
Driven by both a conceptual and critical lens, Steven brought forward a powerful vision: to turn hard data into an engaging, thought-provoking display that would question not only media bias but also society’s perception of human value through visibility. This project reflects his broader mission of using technology and design as tools to reveal hidden patterns and spark conversation.
A data-driven art installation that visualizes the relationship between violent deaths due to conflict and their representation in mainstream media coverage, displayed as a live, dynamic index.
Process Design
The vision was to portray the bias of Western media by quantifying "human value" through the lens of acknowledgment and coverage of violent crimes worldwide. This involved developing a mathematical framework, performing extensive data gathering, and ultimately visualizing results in a compelling, ticker-like display.
Workflow Design & Implementation
Our approach began with iterative sprints. First, we built a blueprint for one country, refining data pipelines, computations, and visualizations before scaling globally.
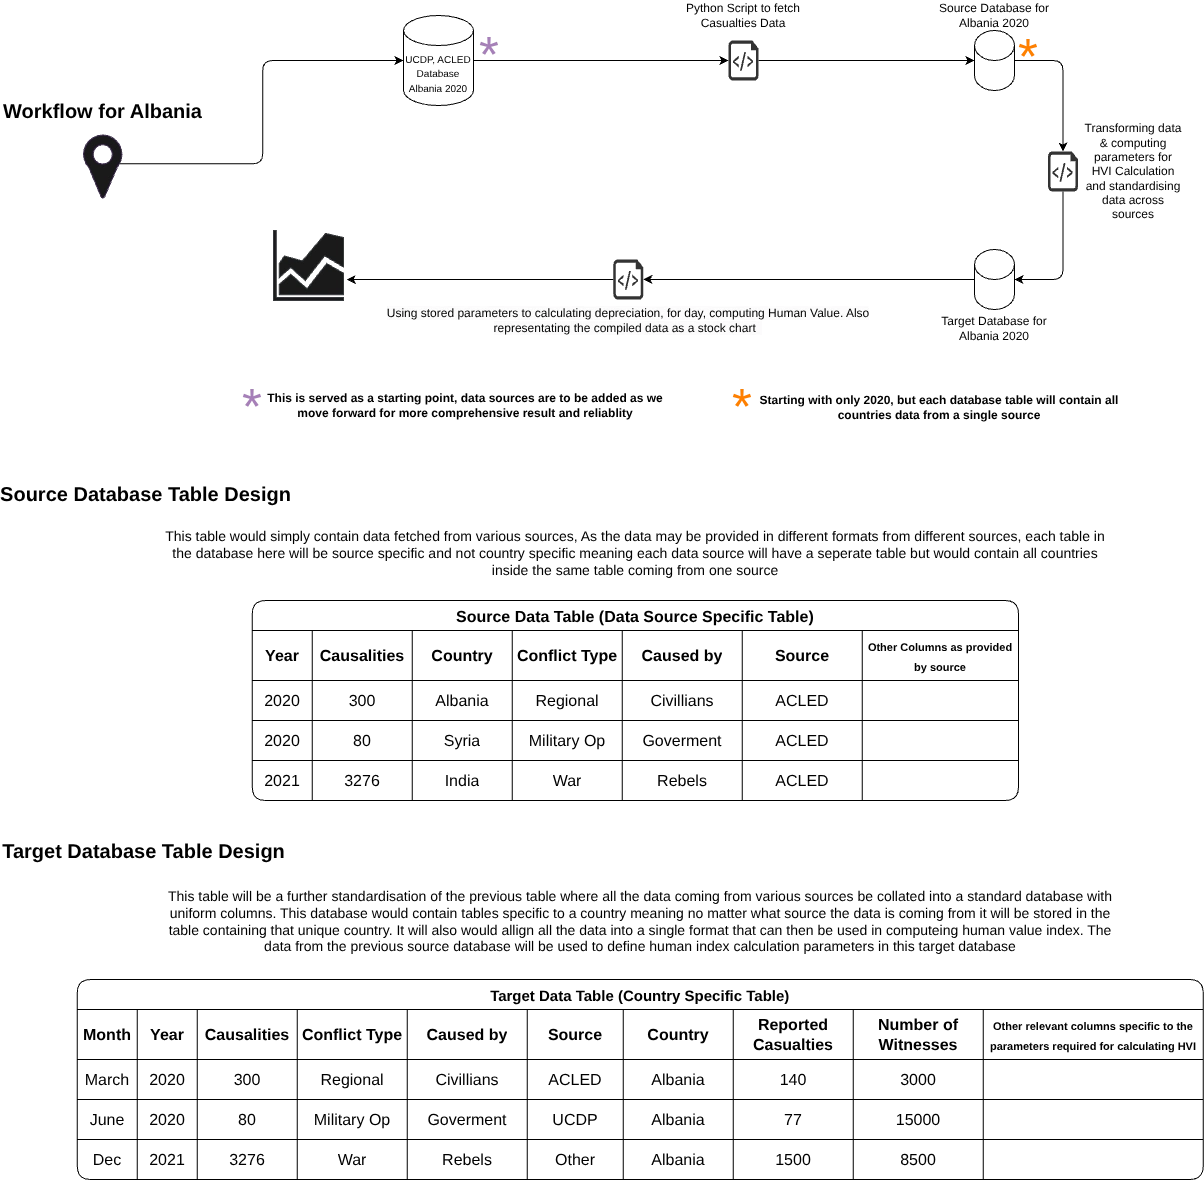
Each sprint included requirements analysis, research, data sourcing, script development, database modeling, and validation. By the end of each sprint, we had a more refined system.
Understanding underlying requirements
Extensive research & Data Hunting
Script & Database Development
Data Modeling & Visualization
Review & Next Sprint Iteration
Sprint I: Parameter Calculation
We sourced data from UNO, WHO, UCDP, and ACLED databases to derive key parameters (year-wise death counts, global deaths, and population metrics). Additionally, we developed an AI-based News Violence Indicator to quantify media coverage intensity and sentiment.
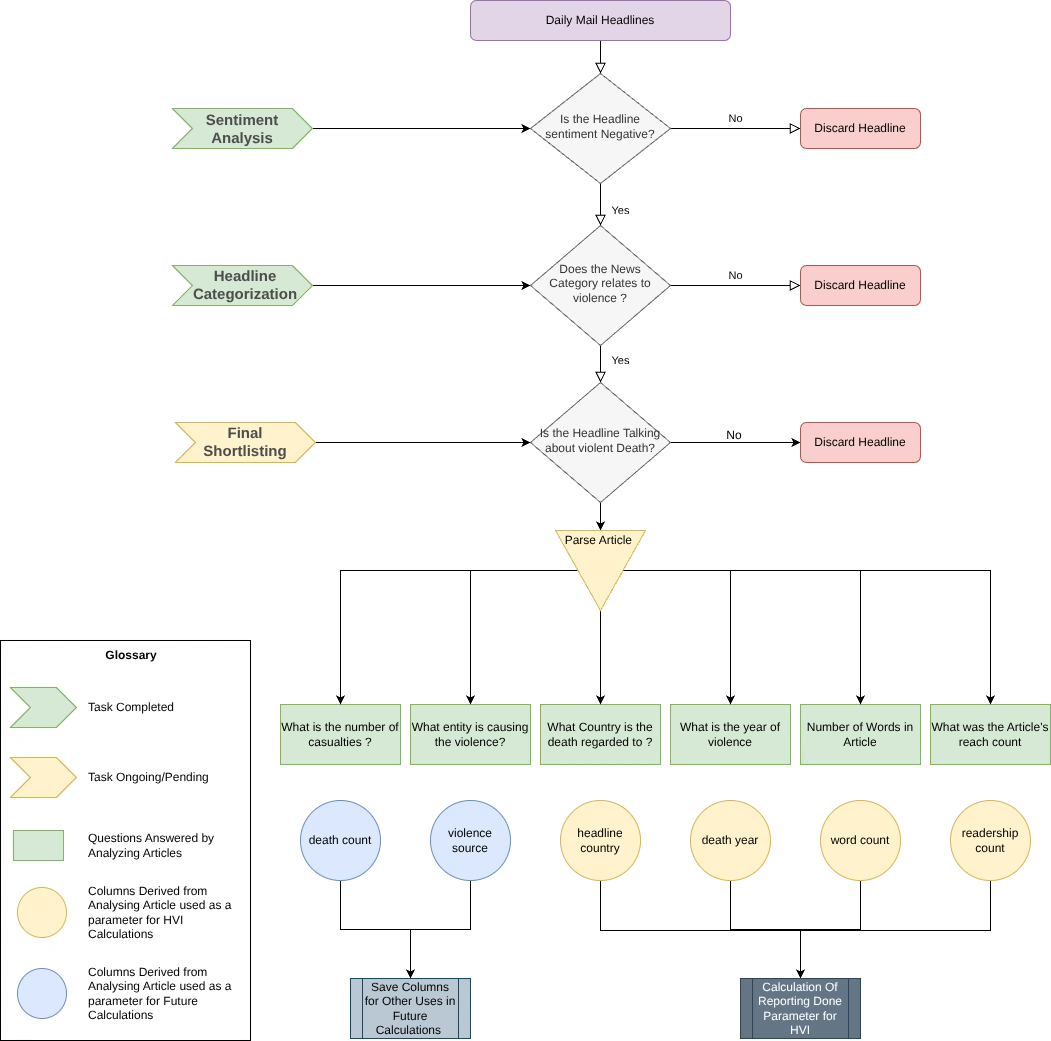
Scraping Process Extracting Headlines from Articles using NLP
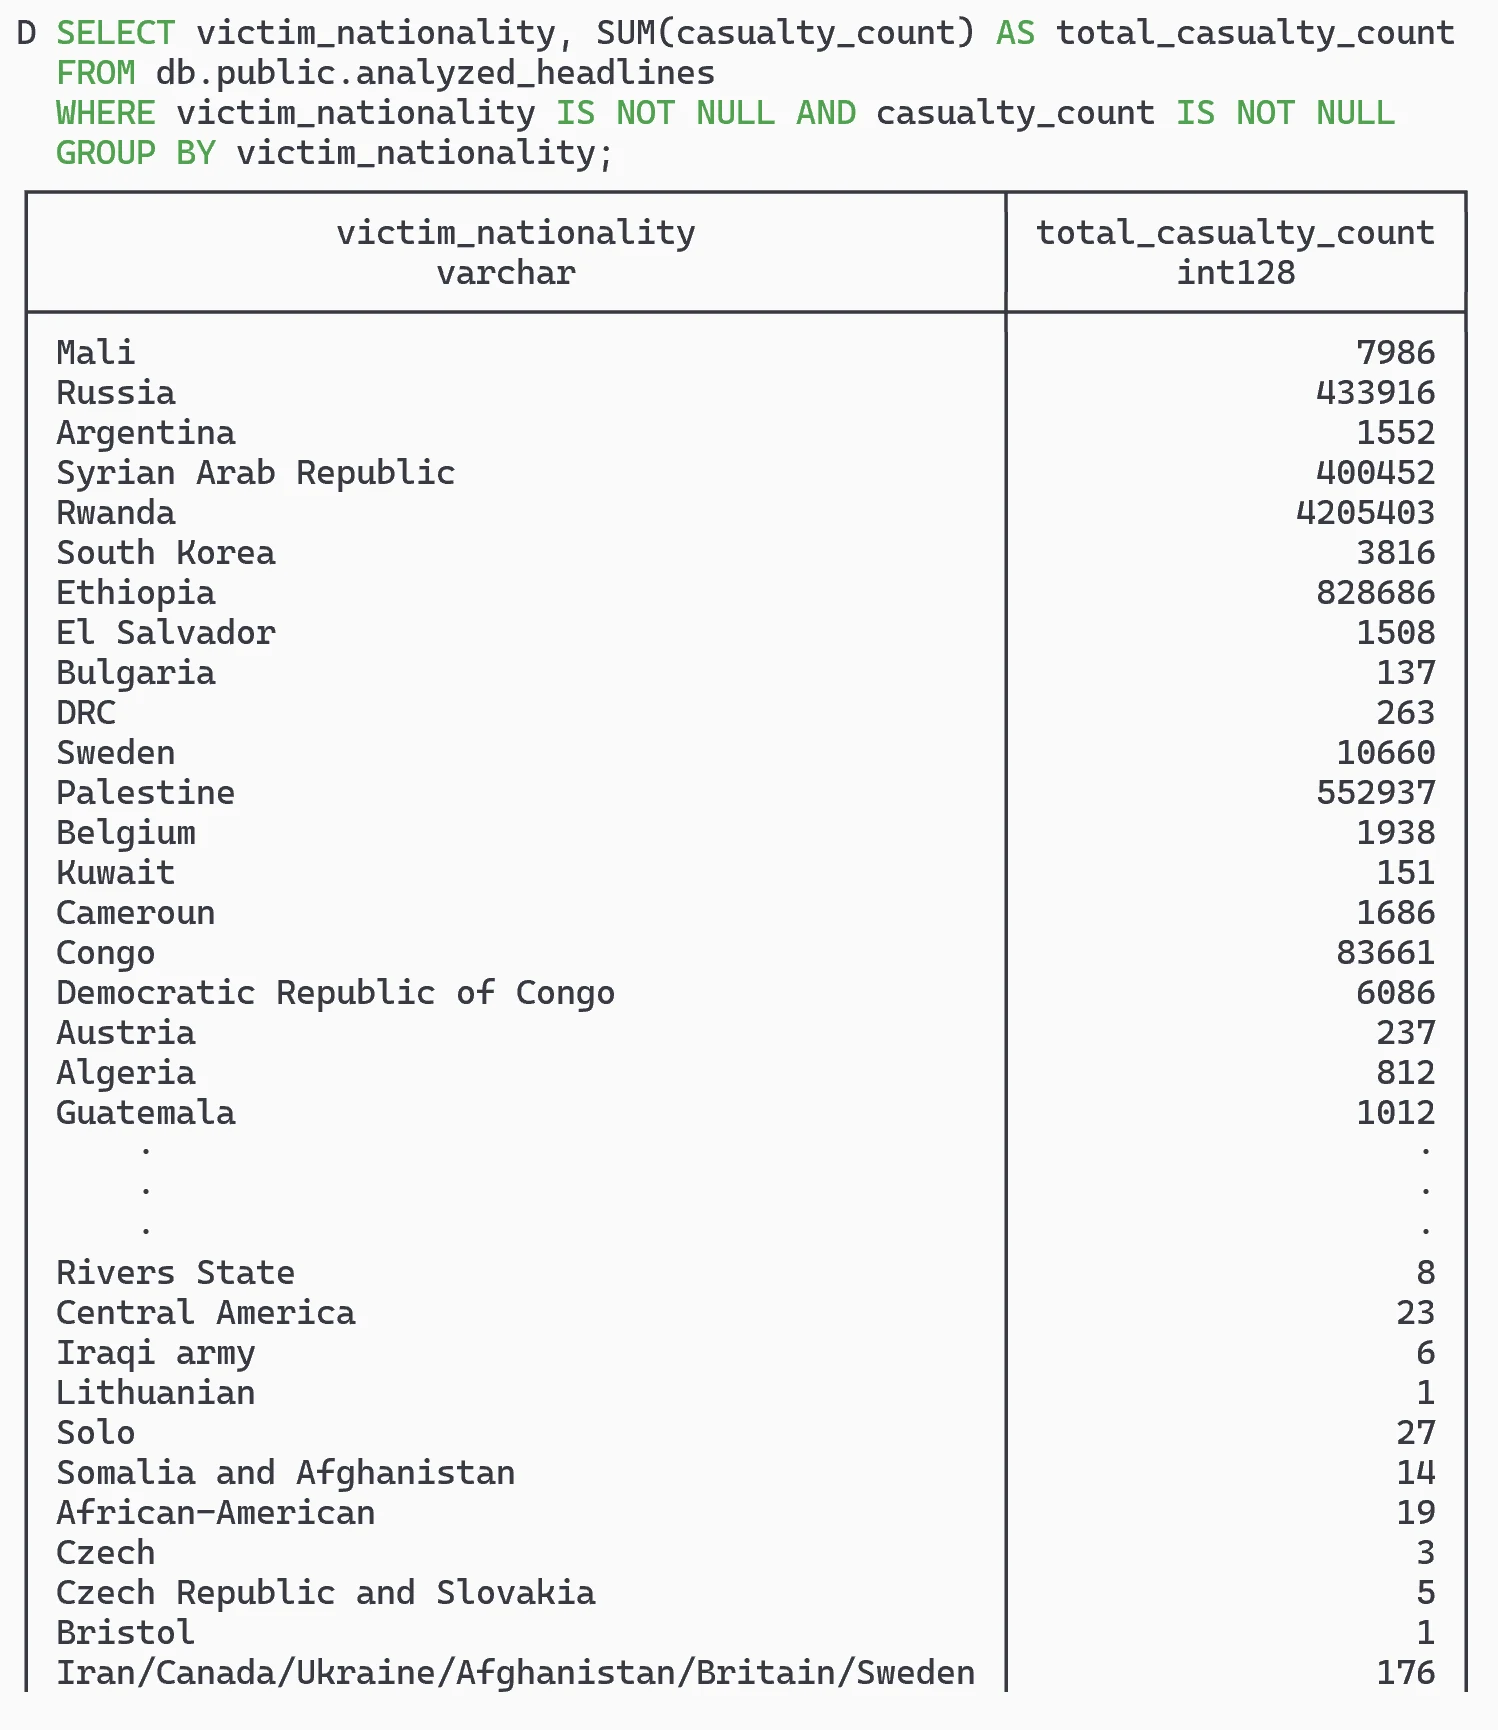
Final Database depicting country wise death toll based on news headlines
Custom Trained model identifying "Violence Score" based on the article headline
Data Sources

Technologies Used
Python
SQL
Wordpress
AWS
OpenAI
Pandas
Client Remarks
"Asif is very helpful and creative and I look forward to continuing to work with him on this project." "Asif has continued to work hard in pursuing a solid outcome to this project. It's genuinely exciting to see everything coming together. Really appreciate your perseverance on this!"
Like this project
Posted Sep 25, 2025
Data-driven art installation visualizing media bias in coverage of violent deaths.
Likes
1
Views
6
Timeline
Jun 18, 2024 - Sep 30, 2024


AI Business Contact Scraper
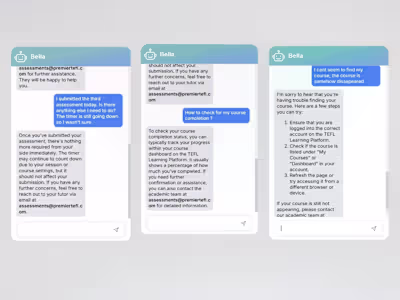
Learning Platform (Moodle) AI Chatbot 🤖

Airtable Powered AI Chatbot

Custom chatGPT voice assistant chatbot