Weather Infographic
Faith Kierzek
Weather Infographic
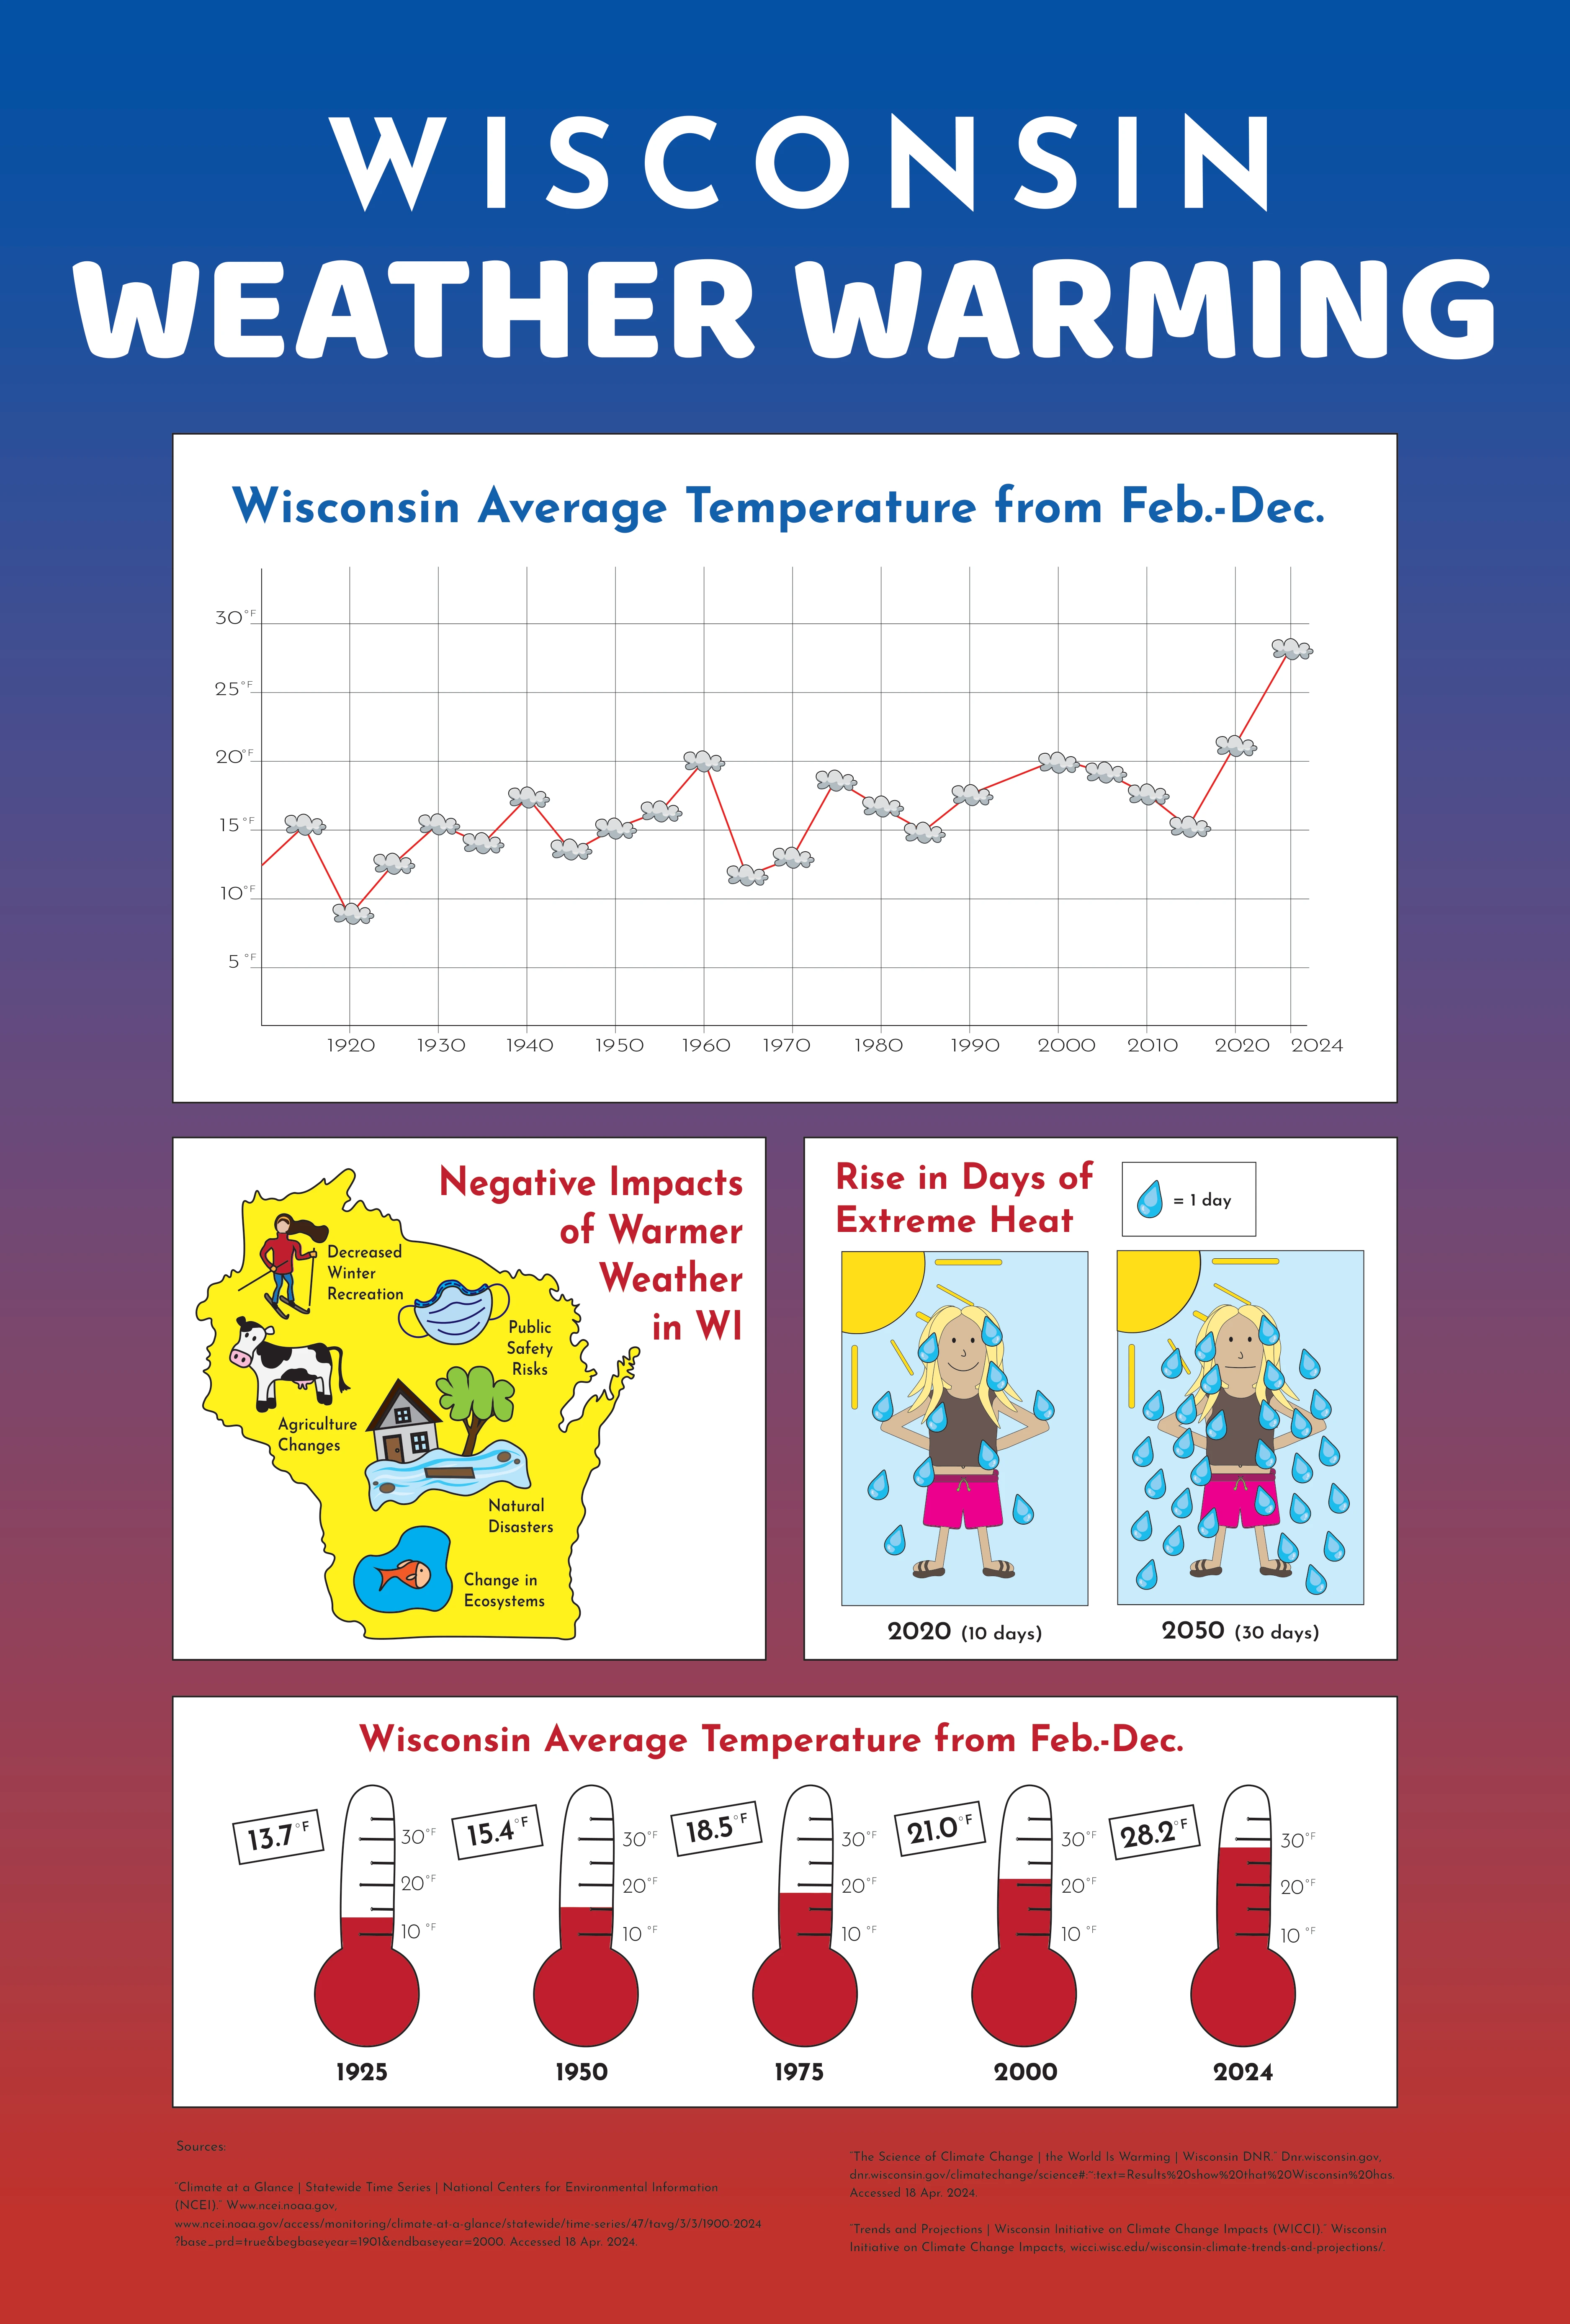
Project Details: While enrolled in ART 312, ‘Design Across the Disciplines’, I created an infographic to represent specific data points of my choosing. I chose to research and illustrate Wisconsin’s temperature increase over the past century. I illustrated each separate item using various tools within Adobe Illustrator. Then, I designed each data graph in separate files and combined them into one cohesive final infographic.
Like this project
Posted Jun 18, 2024
In ART 312, I crafted an infographic showing Wisconsin's temperature rise. Using Illustrator, I illustrated then integrated data graphs into a cohesive graphic.
Likes
0
Views
4