Time Series and Trend Analysis for MovieLens
Ciro
Case Study: Time Series and Trend Analysis (MovieLens)
Overview
Built a data pipeline solution combining advanced SQL, Python ETL, and Power BI dashboards to analyze user behavior in the MovieLens dataset. Extracted time series metrics and identified long‑term growth trends and seasonal patterns in ratings activity.
Challenge
Raw rating data in PostgreSQL lacked aggregated temporal insights. The challenge was to design a pipeline that could transform millions of records into interpretable metrics, revealing both cumulative growth and recurring seasonal patterns.
Approach
SQL Window Functions:
Aggregated ratings by month.
Applied SUM() OVER (...) to calculate cumulative totals (running growth curve).
ETL with Python:
Executed SQL queries, handled nulls, enforced float types, and exported results to CSV.
Secured database credentials via config.py.
Visualization in Power BI: Imported ETL outputs to build dashboards showing growth trajectory and annual seasonality.
Solution
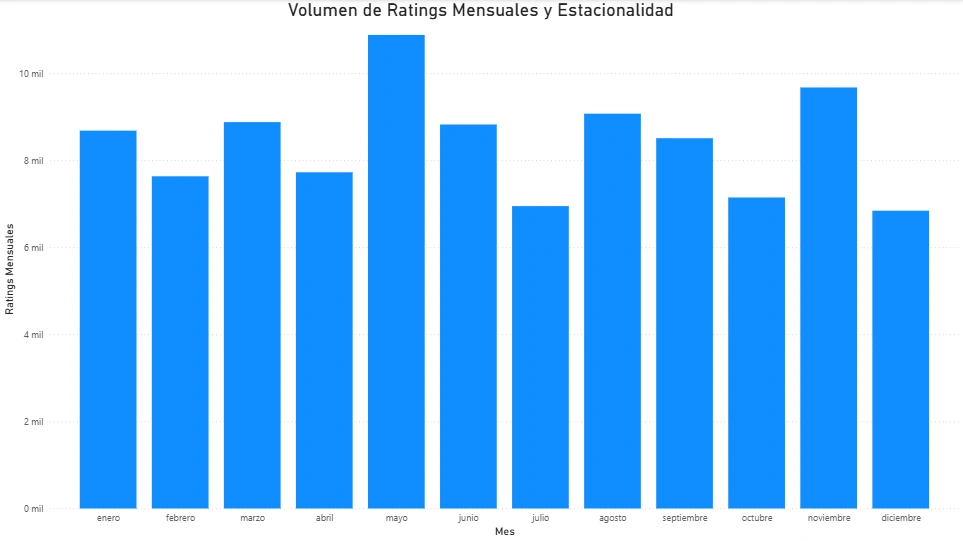
Delivered a time series analysis pipeline that revealed:
Historical Growth Curve: Rapid early adoption, stabilization, and renewed growth around 2015.
Seasonality Pattern: Peak activity in May and November, with July consistently showing lower engagement.
Impact
Business Intelligence: Provided executives with clear visuals of platform maturity and user engagement cycles.
Scalability: Demonstrated integration of SQL, Python, and BI tools for large‑scale temporal analysis.
Actionable Insights: Enabled resource planning and strategic decisions based on seasonal usage trends.
Like this project
Posted Jan 2, 2026
Developed a data pipeline using SQL, Python, and Power BI for MovieLens trend analysis.
Likes
2
Views
1