Network Analysis on Street Networks
Street/Road networks comparison between Oshawa,Toronto and Paris.
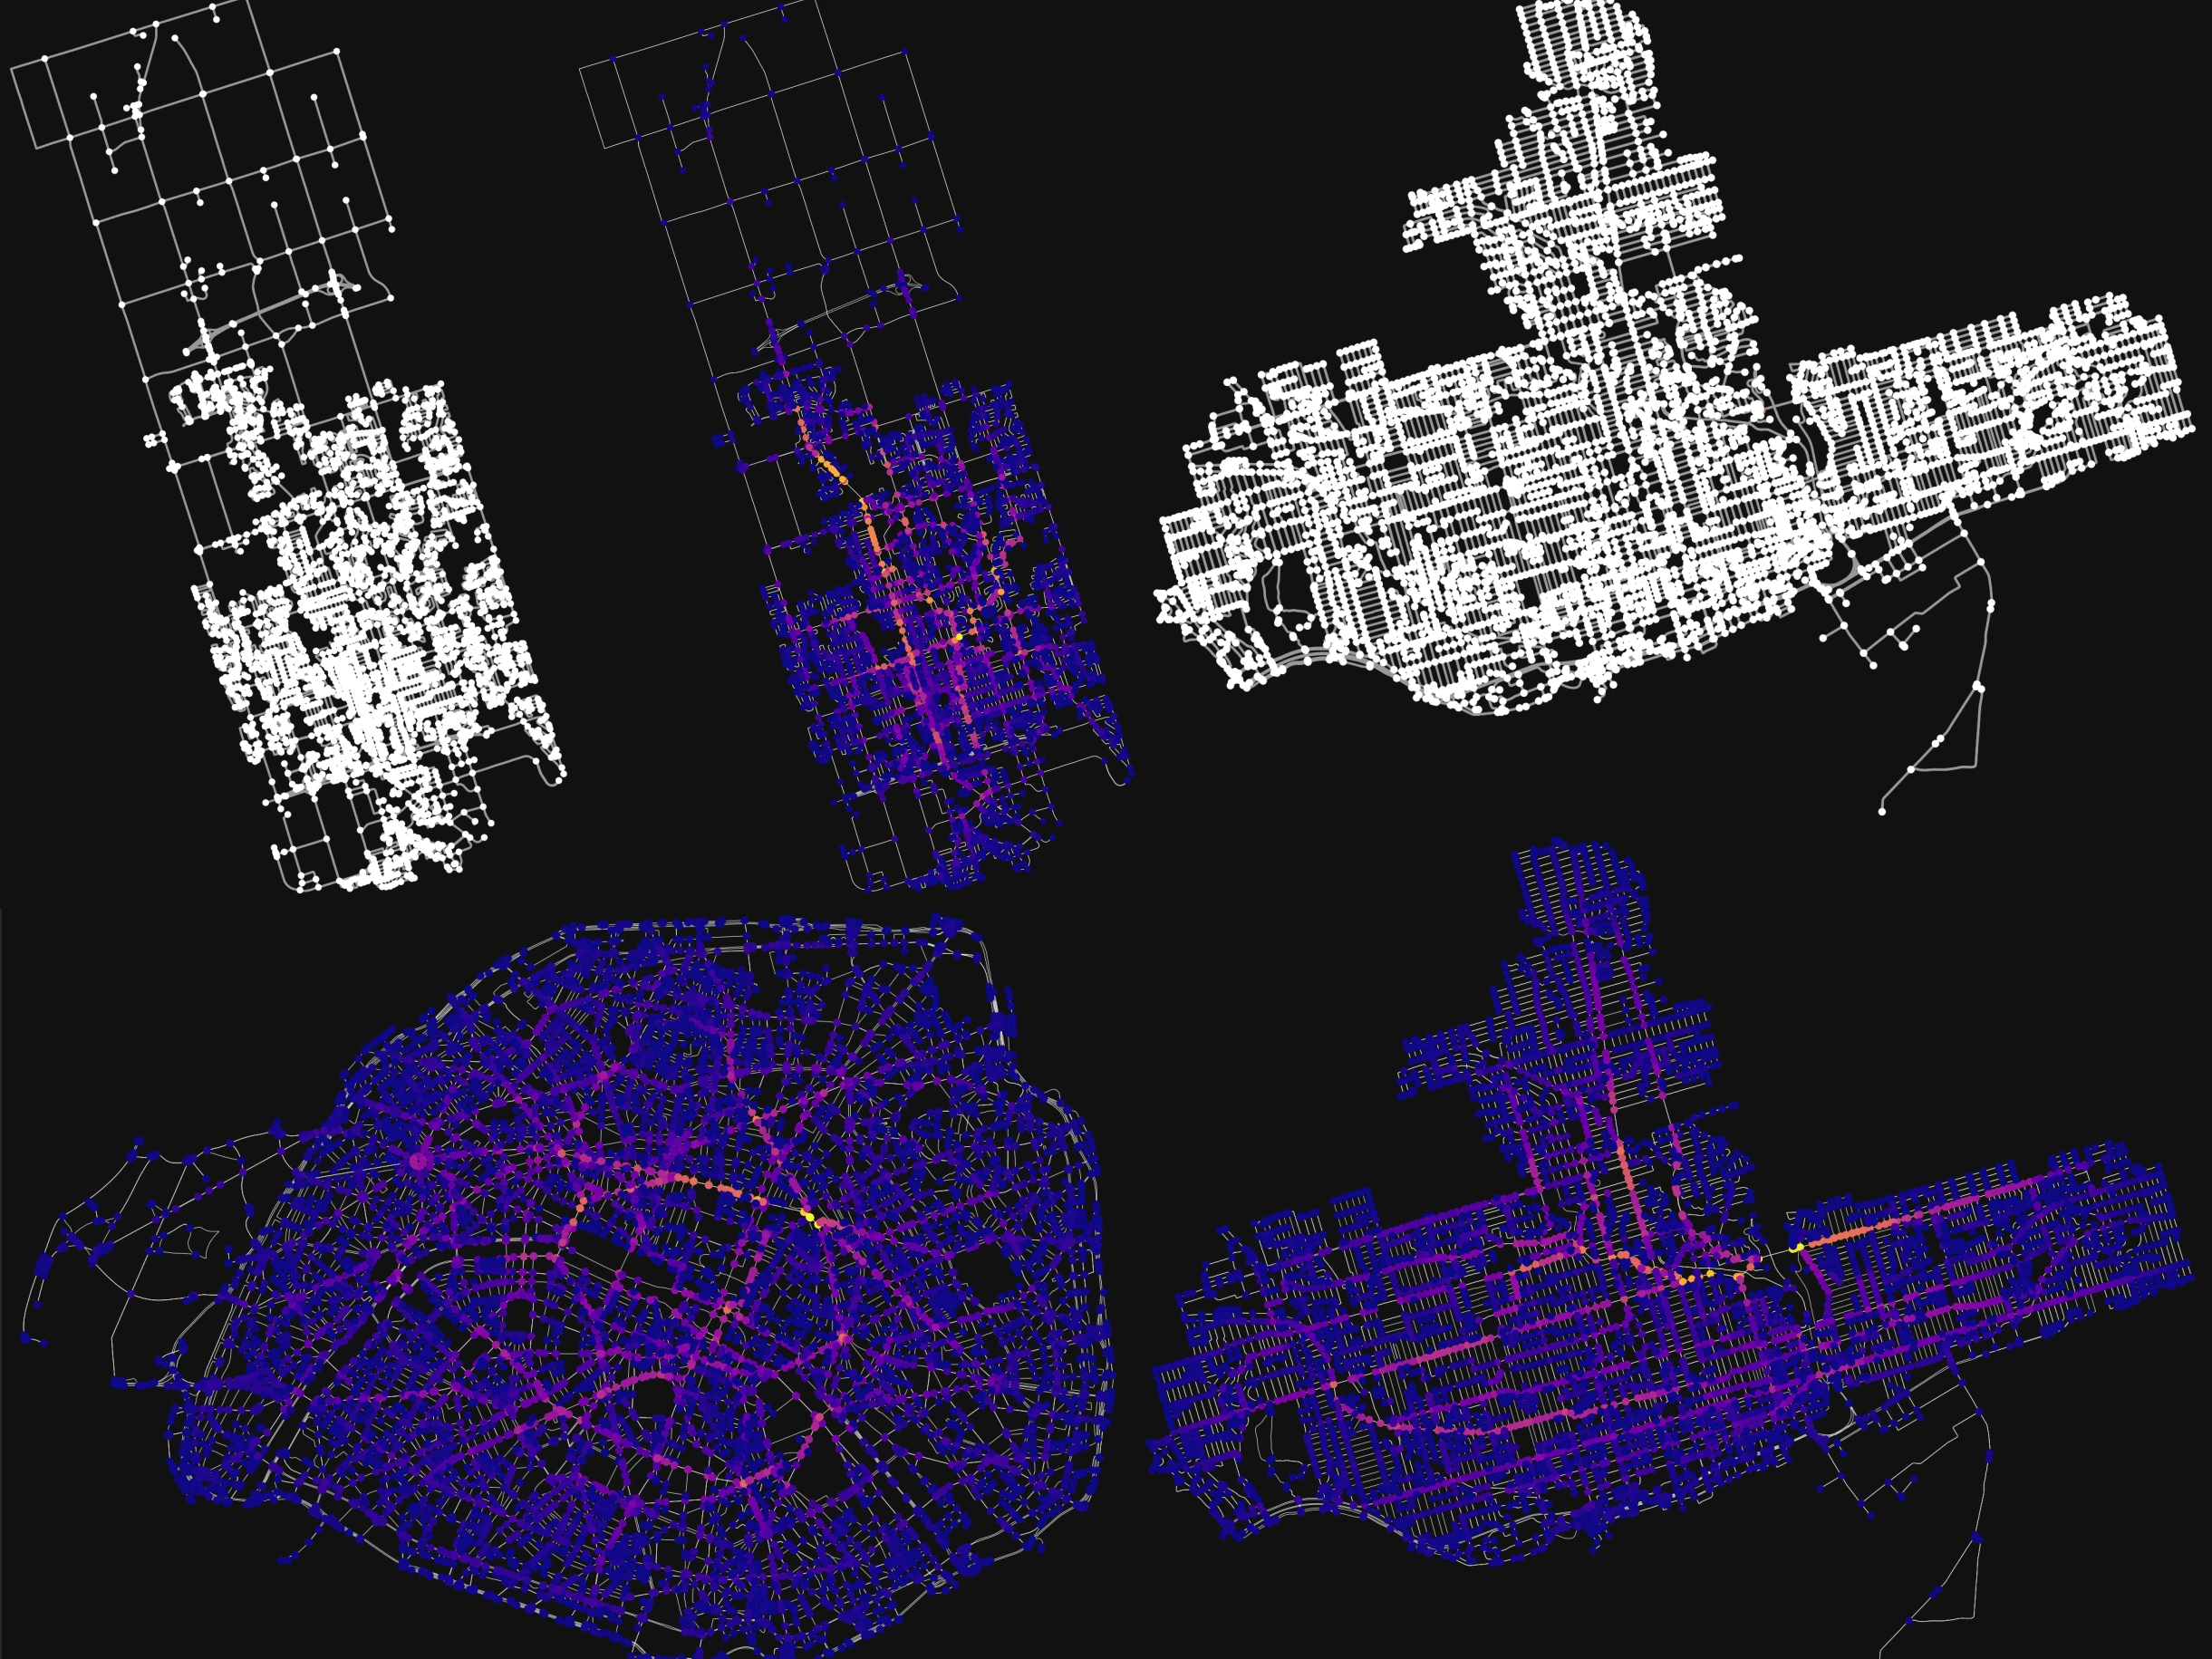
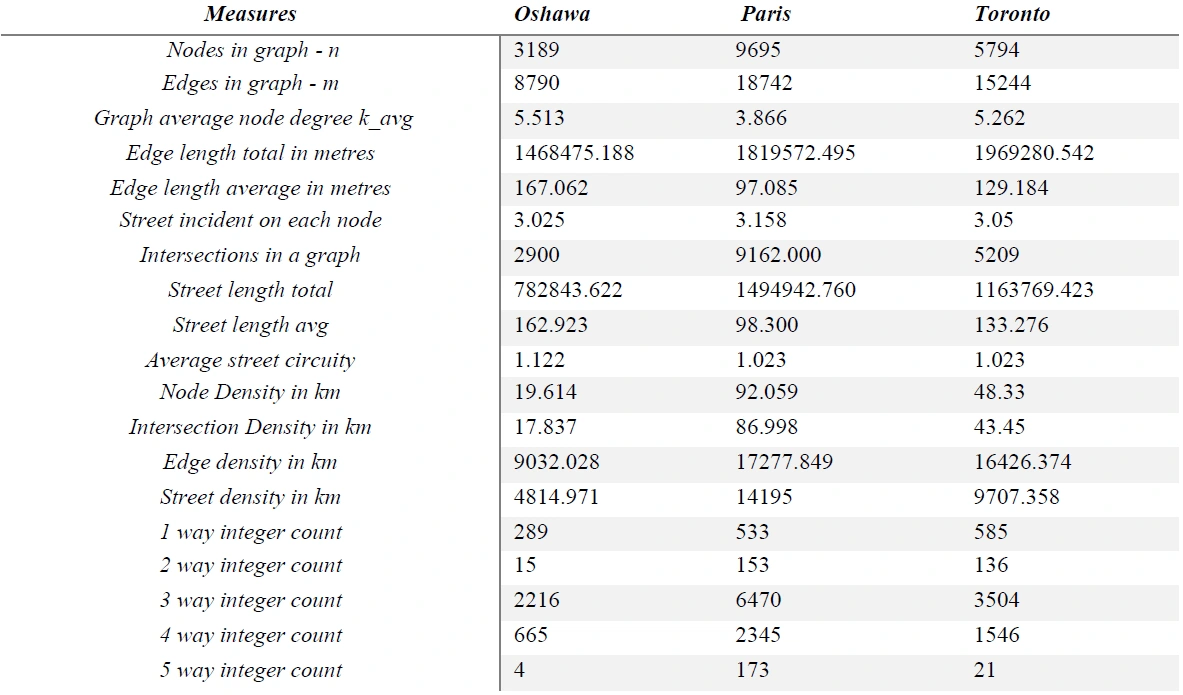
Here in this case study, we are going to analyze three cities, Oshawa, Toronto, and Paris. Two cities in Canada and one city in Europe to compare the empirical statistics of these three different metropolises. These research sites are tiny yet do not correspond to complete neighbourhood boundary definitions, although they are valuable for visual comparisons among sites at quite a local scale. After that, with the help of the OpenStreetMap Network (OSMNx) module, a drivable street network of Oshawa, Toronto, and Paris is downloaded.
The network that is generated has nodes that needed to simplify, it is performed using the "simplify_graph" command in the OSMNx module. Even for outlying junctions where there are no roadways, because of the restricted parameters, it provides insights into the right amount of streets radiating from each node. Some nodes in this first network seem to b centrally placed among the street segment and would have been removed during the simplification process. OpenStreetMap has rightly retained the real crossings they merely cross a street that links to a node beyond the boundary of the restricted parameter.
Oshawa
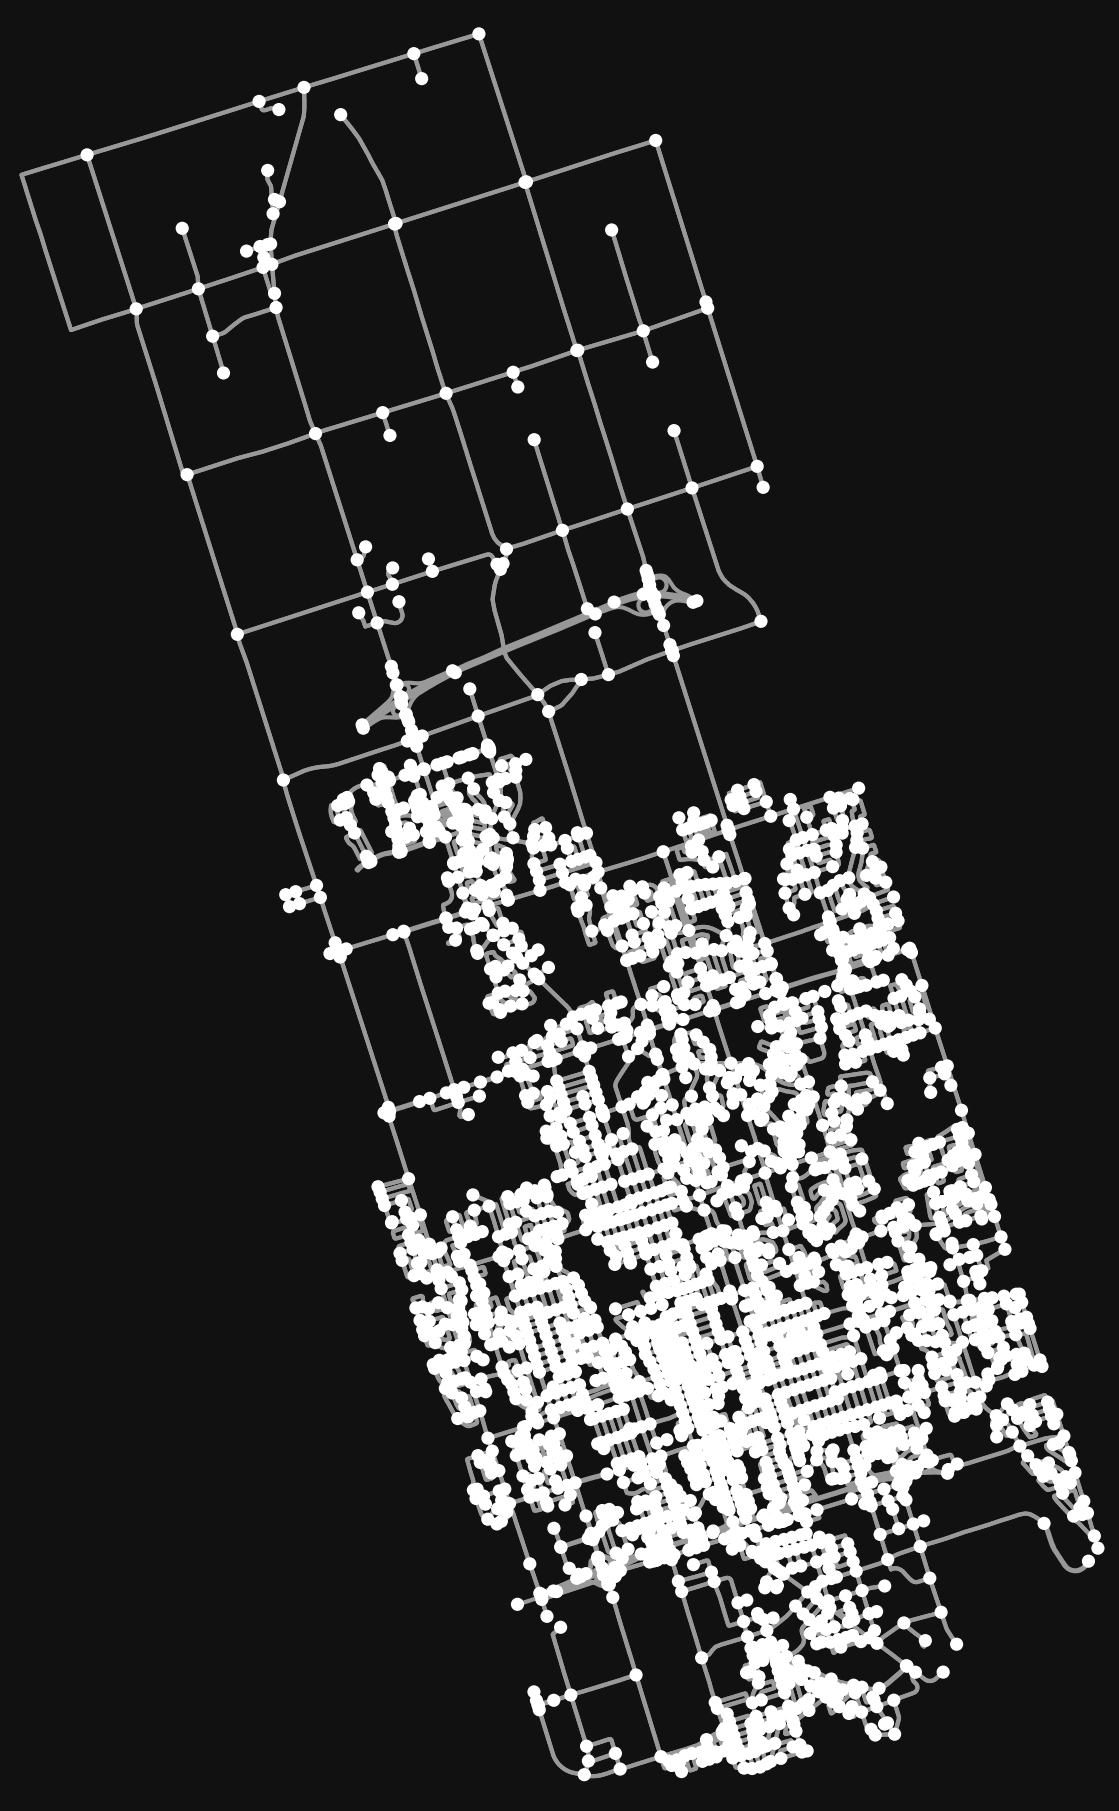
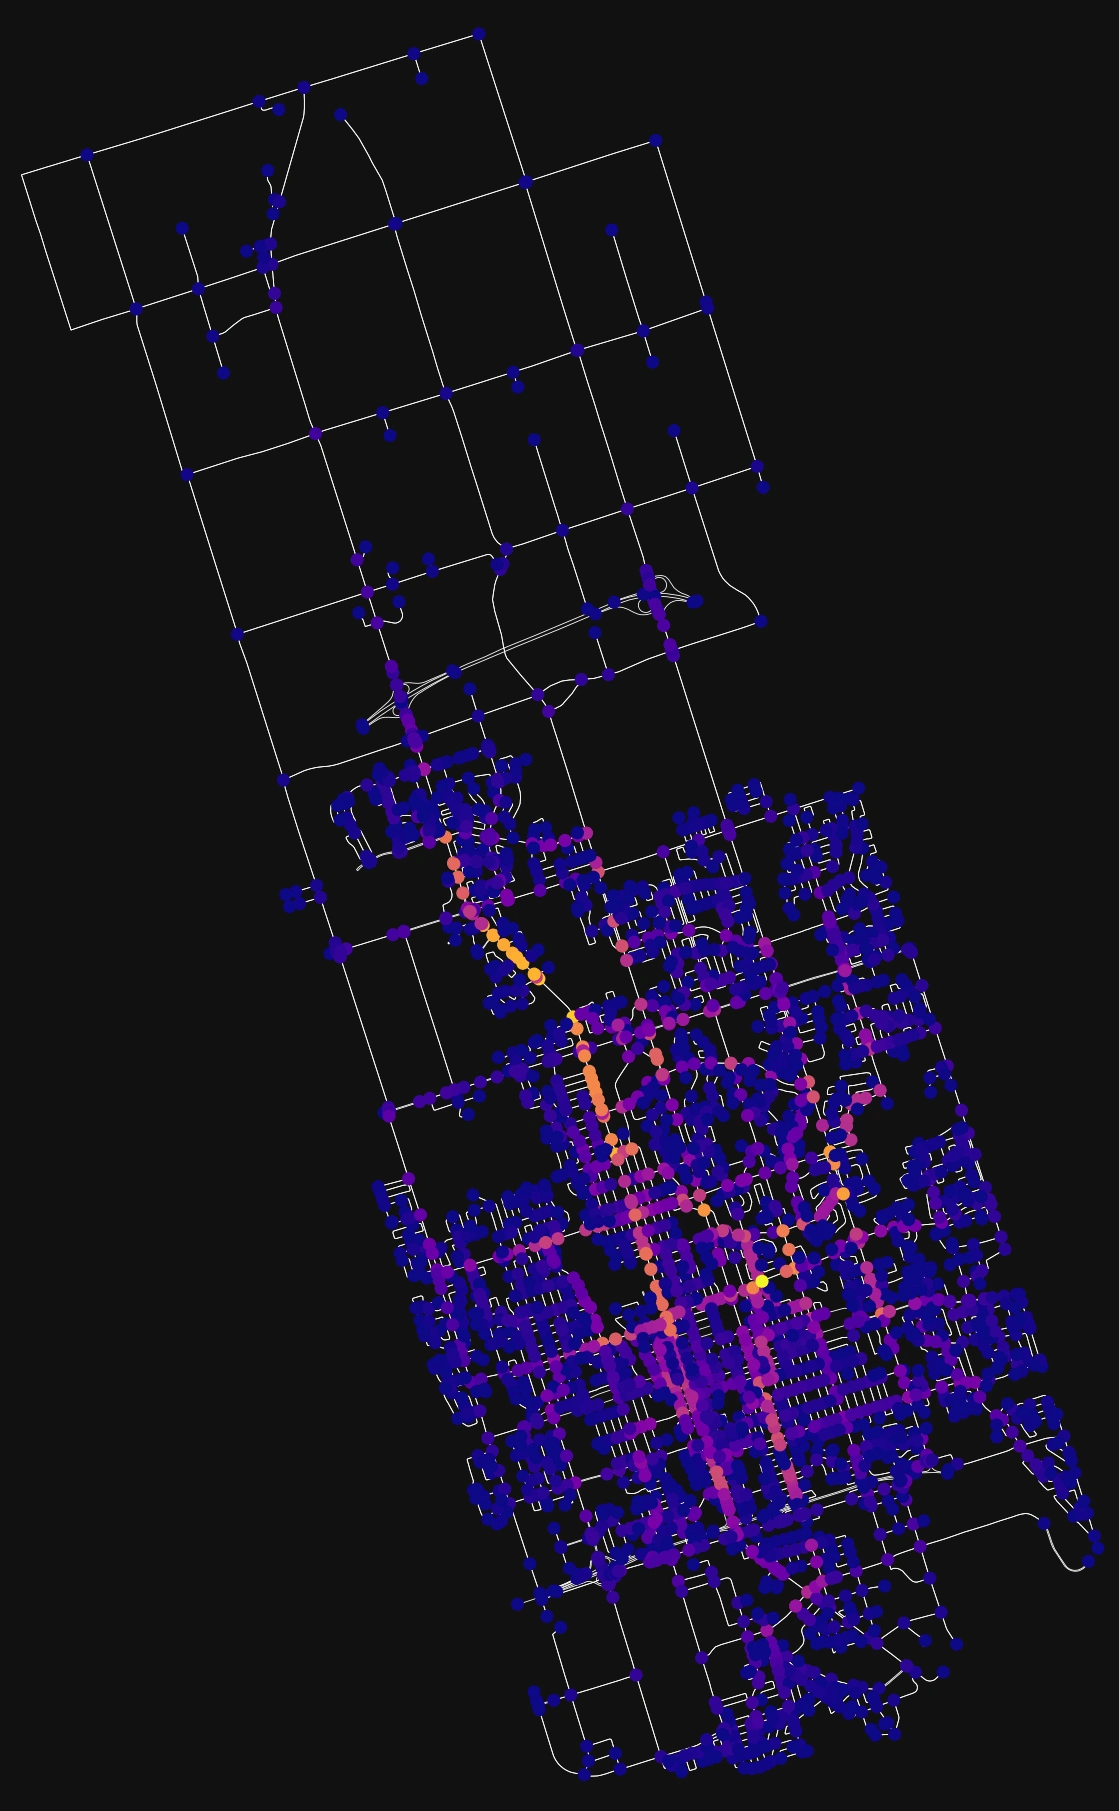
Ranked color nodes on betweenness centrality of Oshawa
Toronto
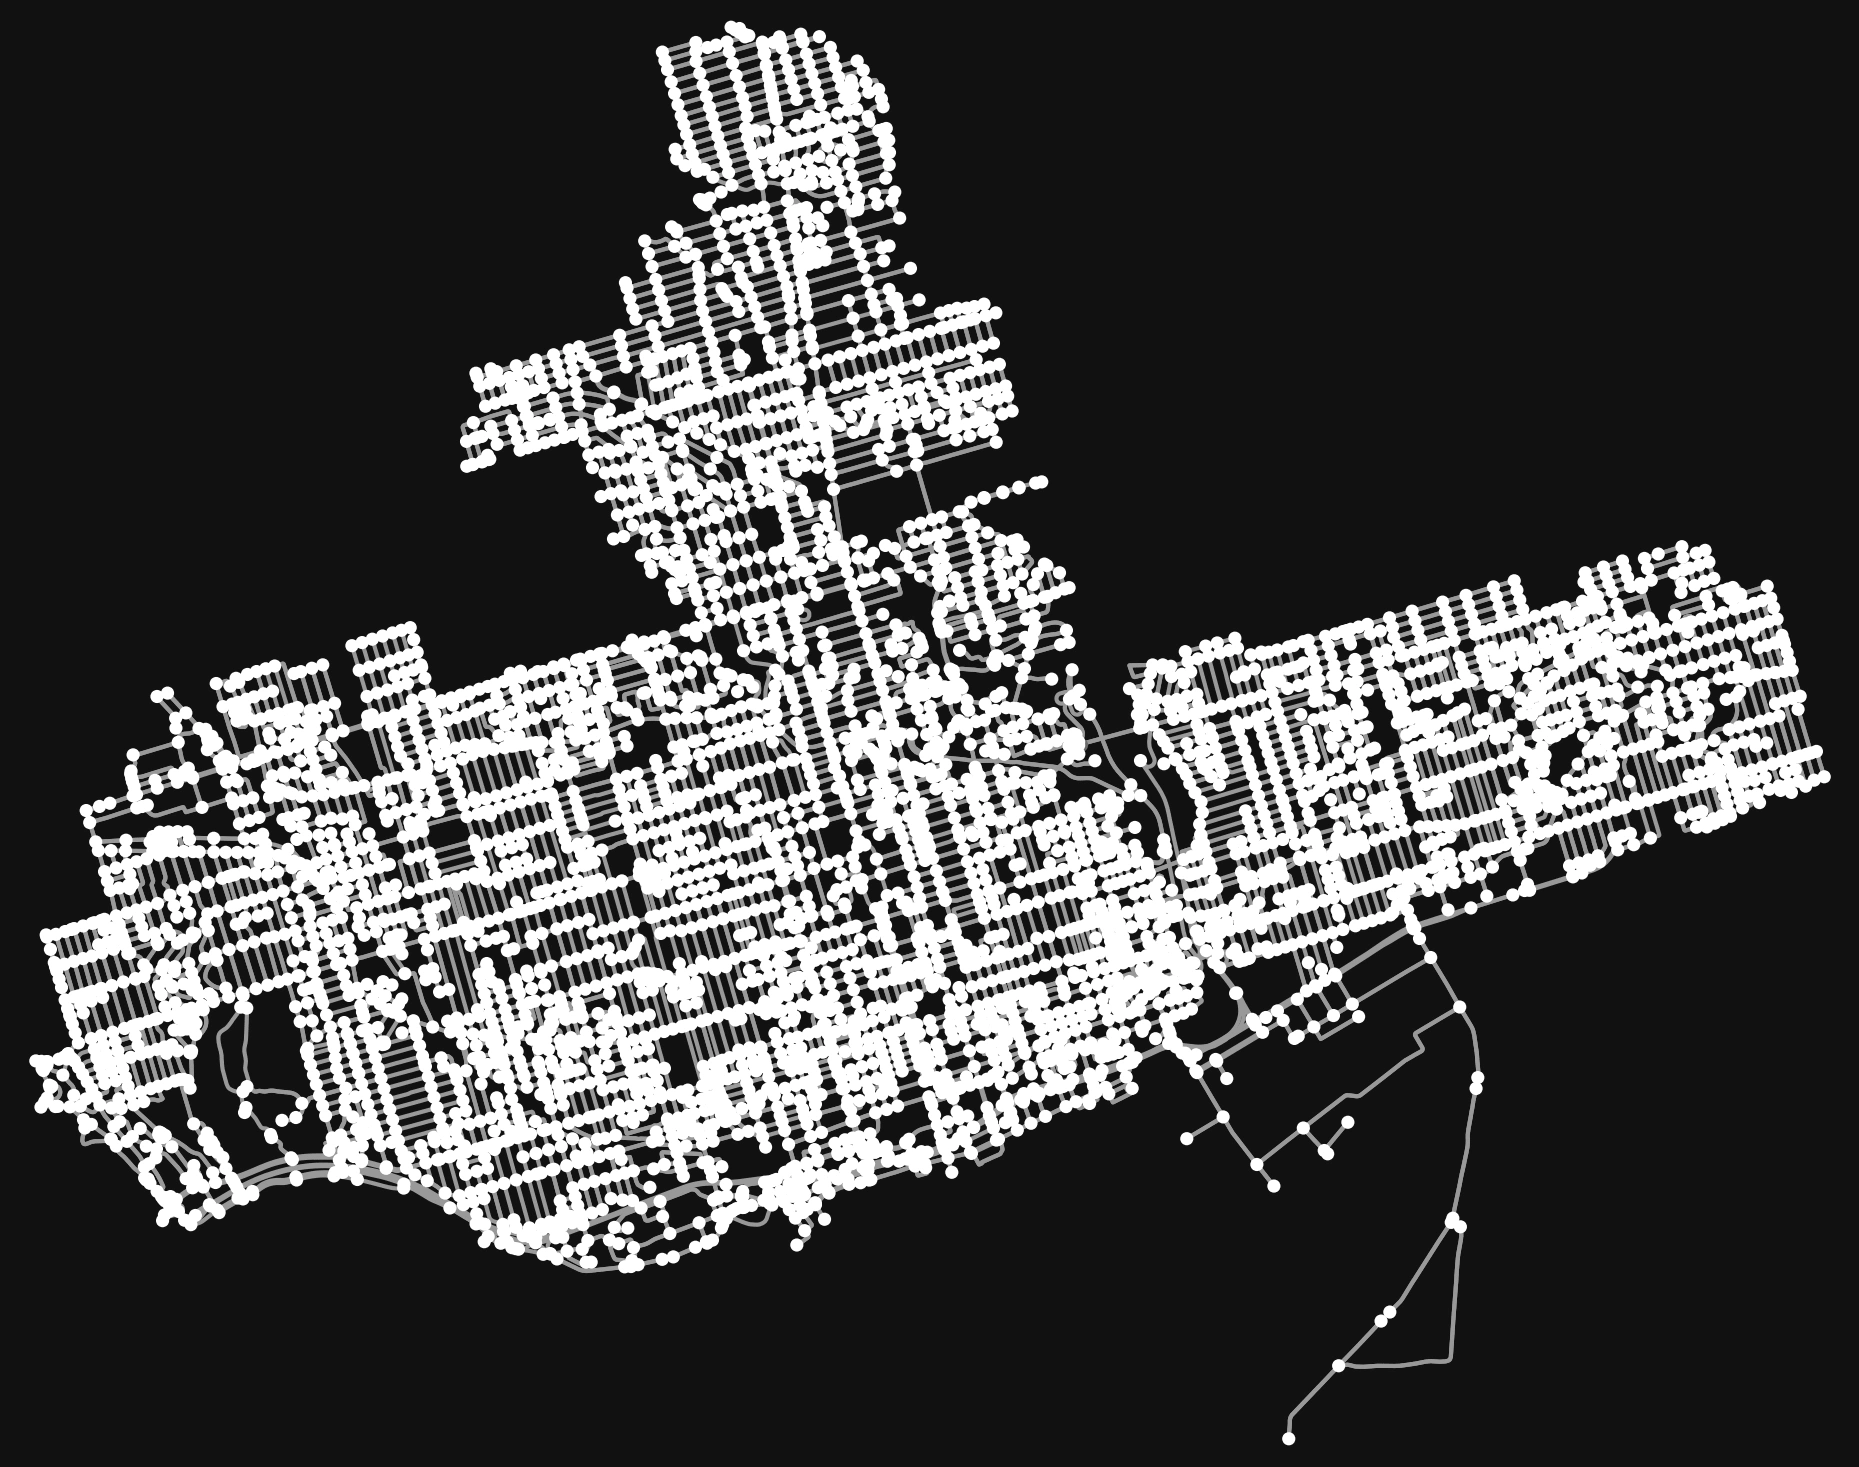
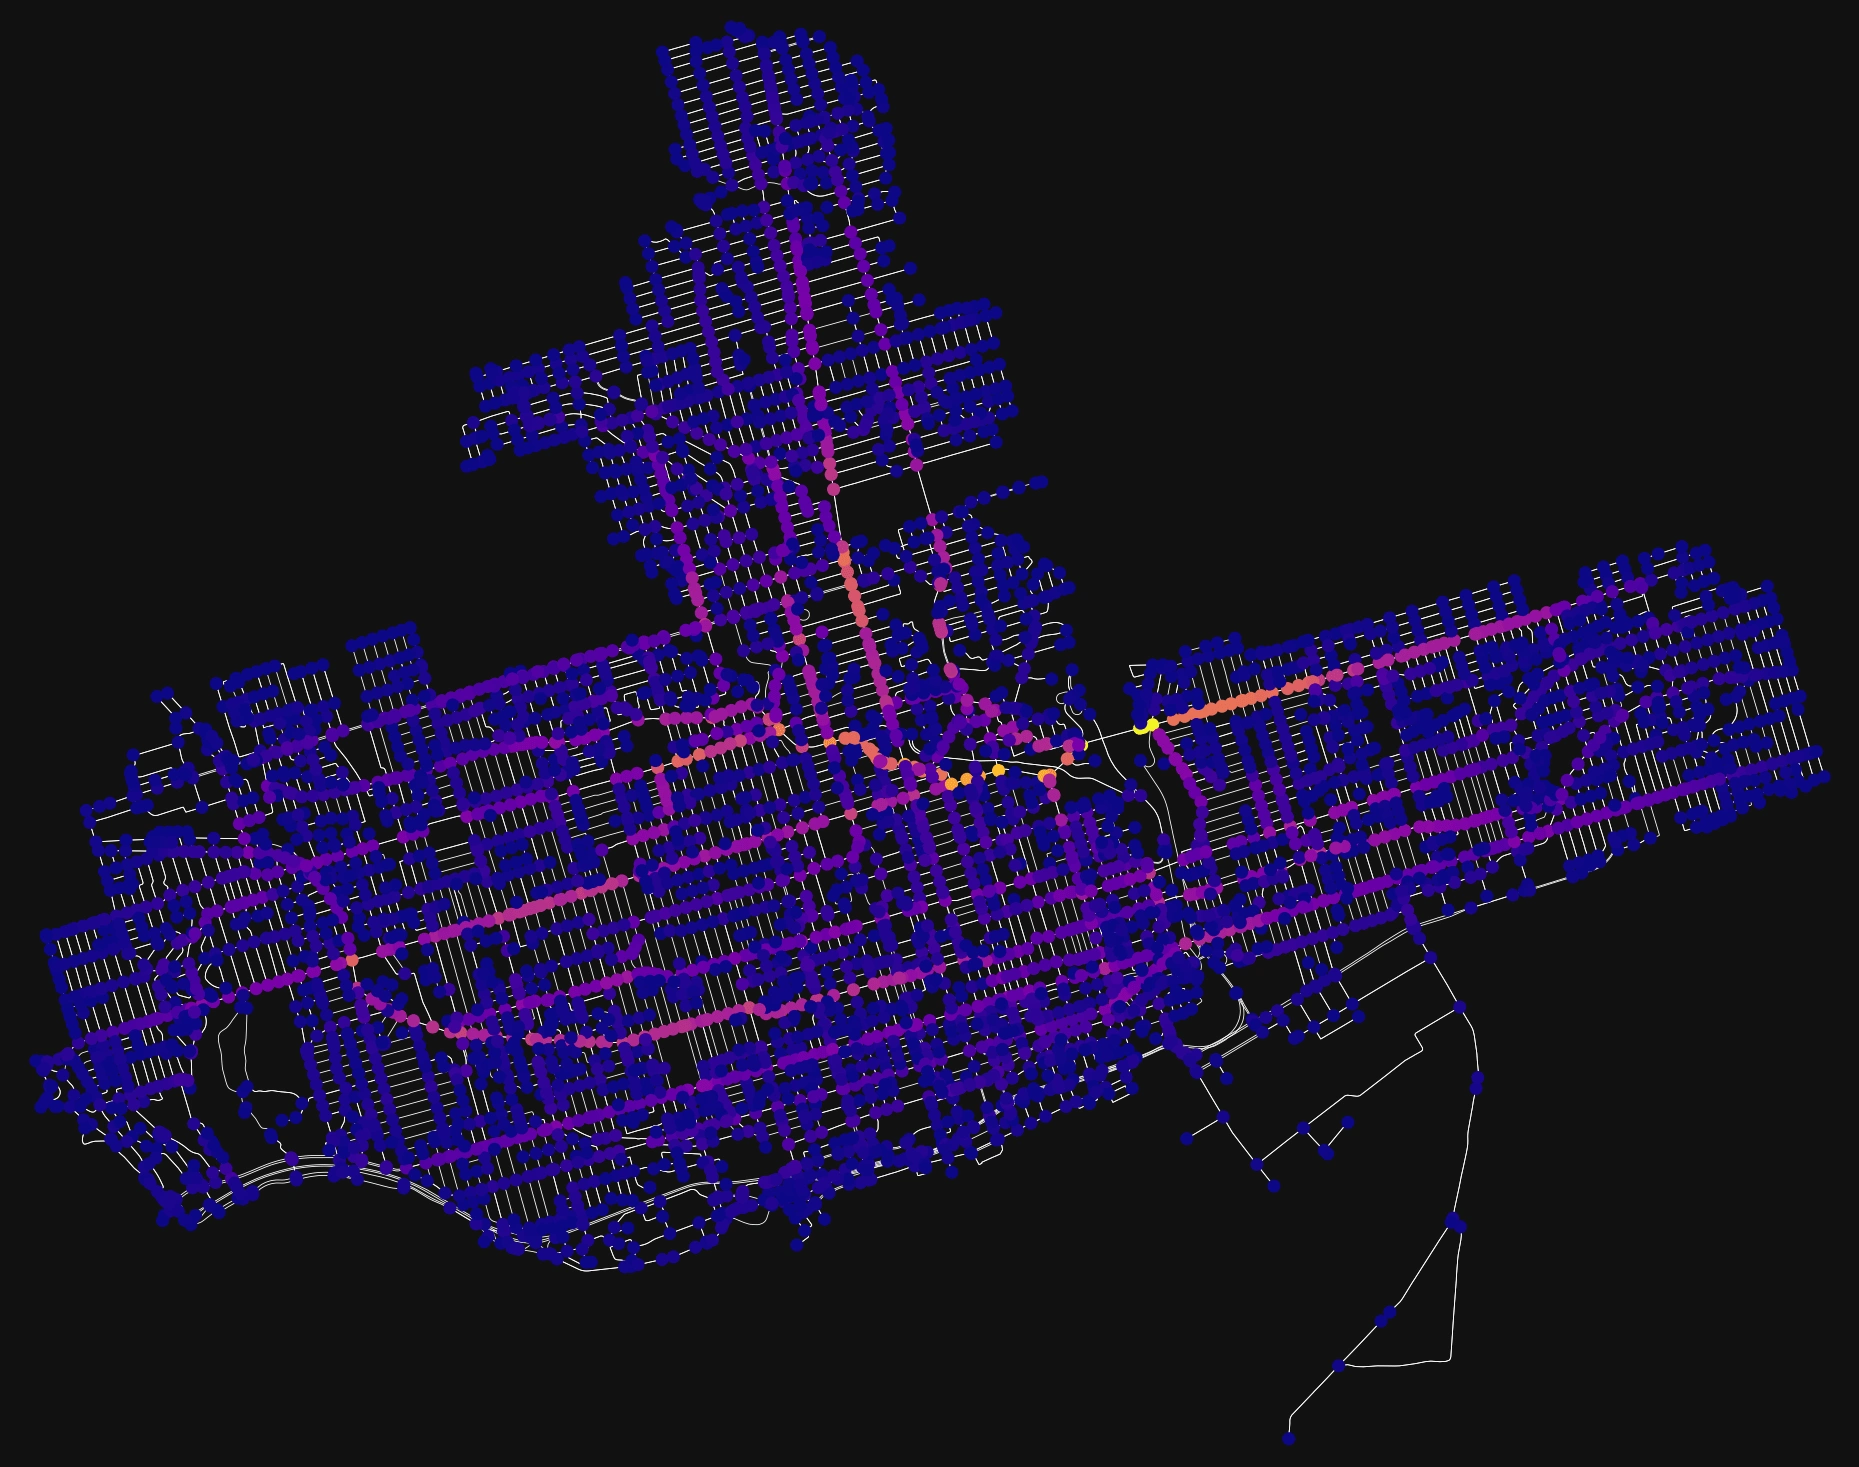
Table of statistics
Paris
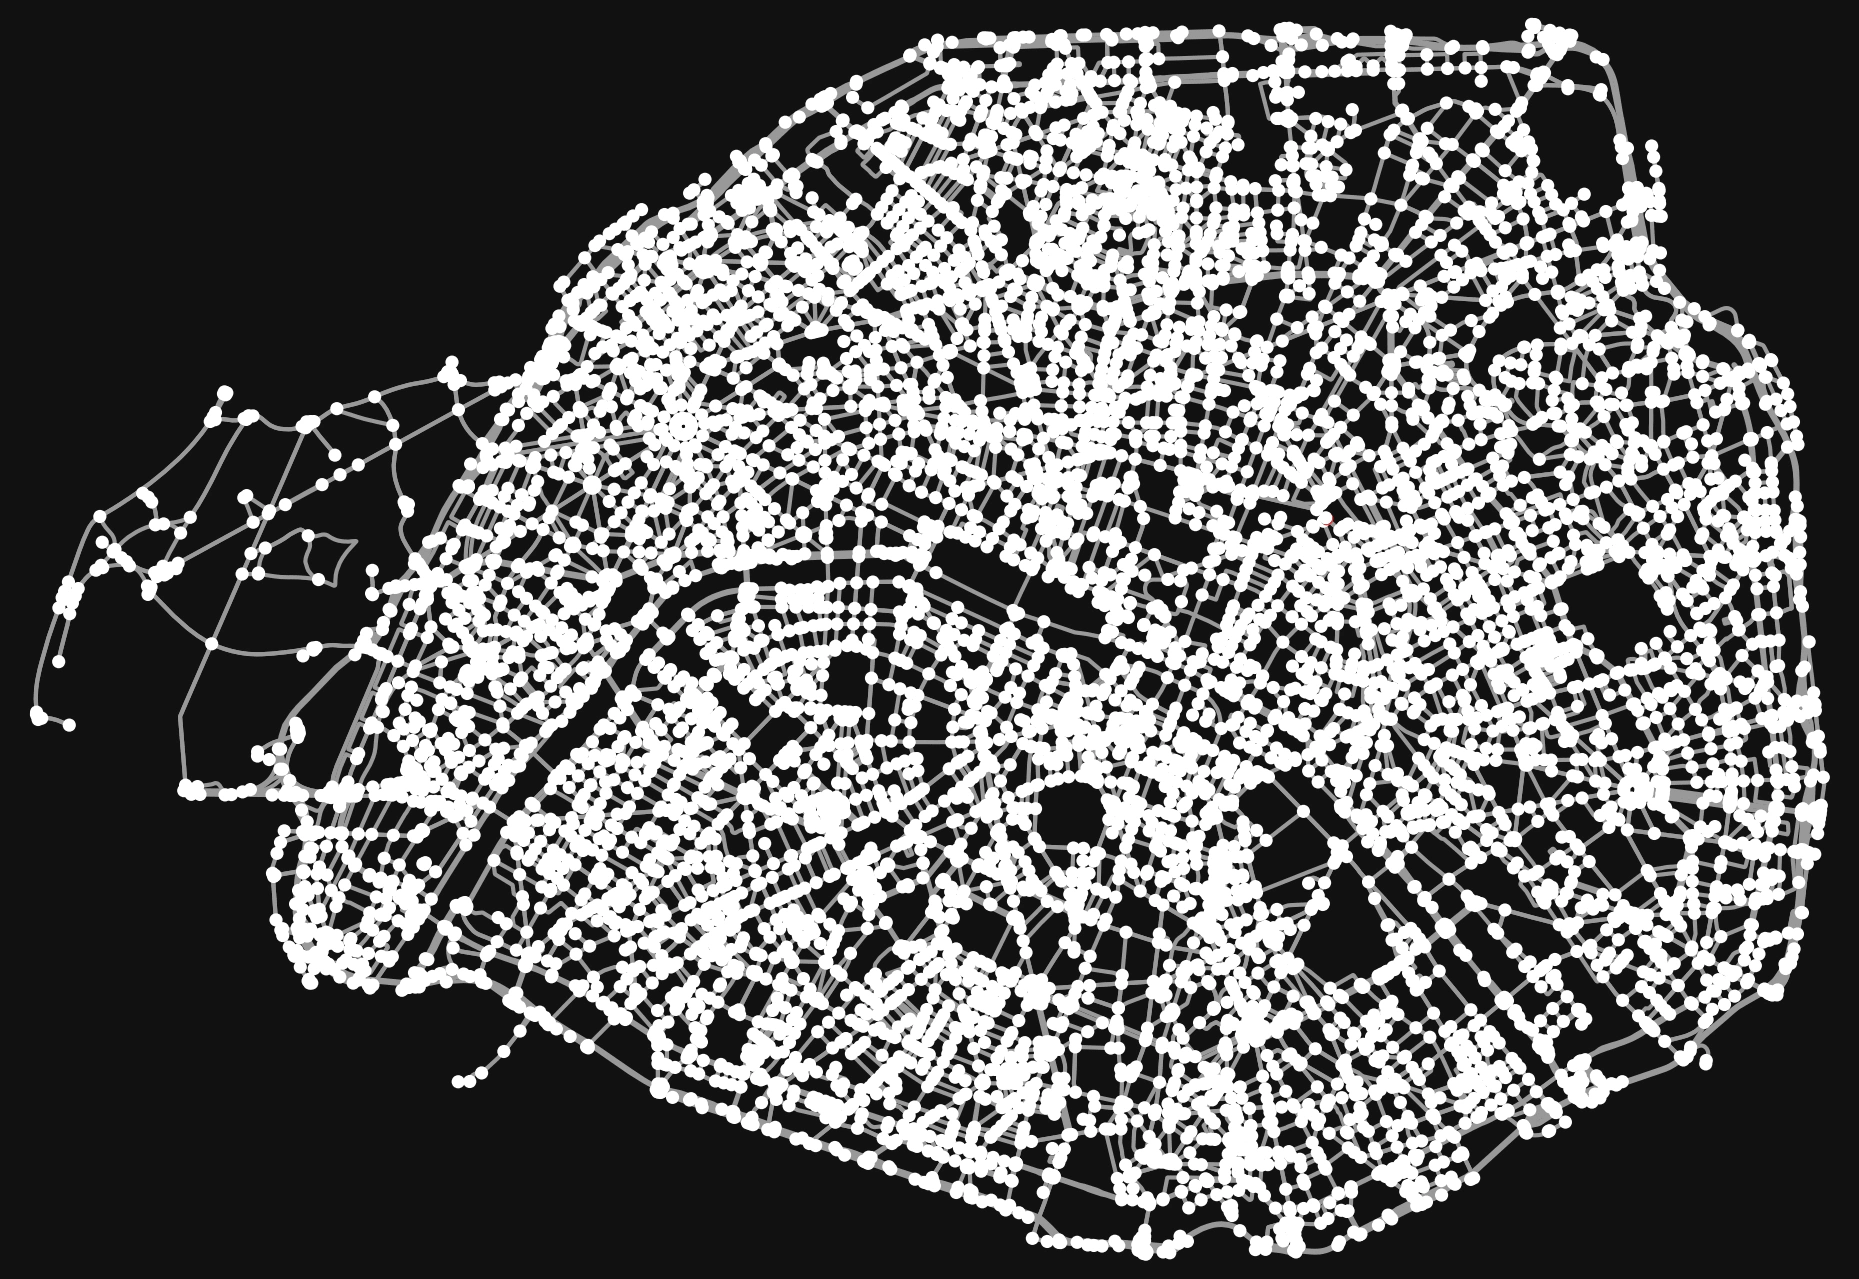
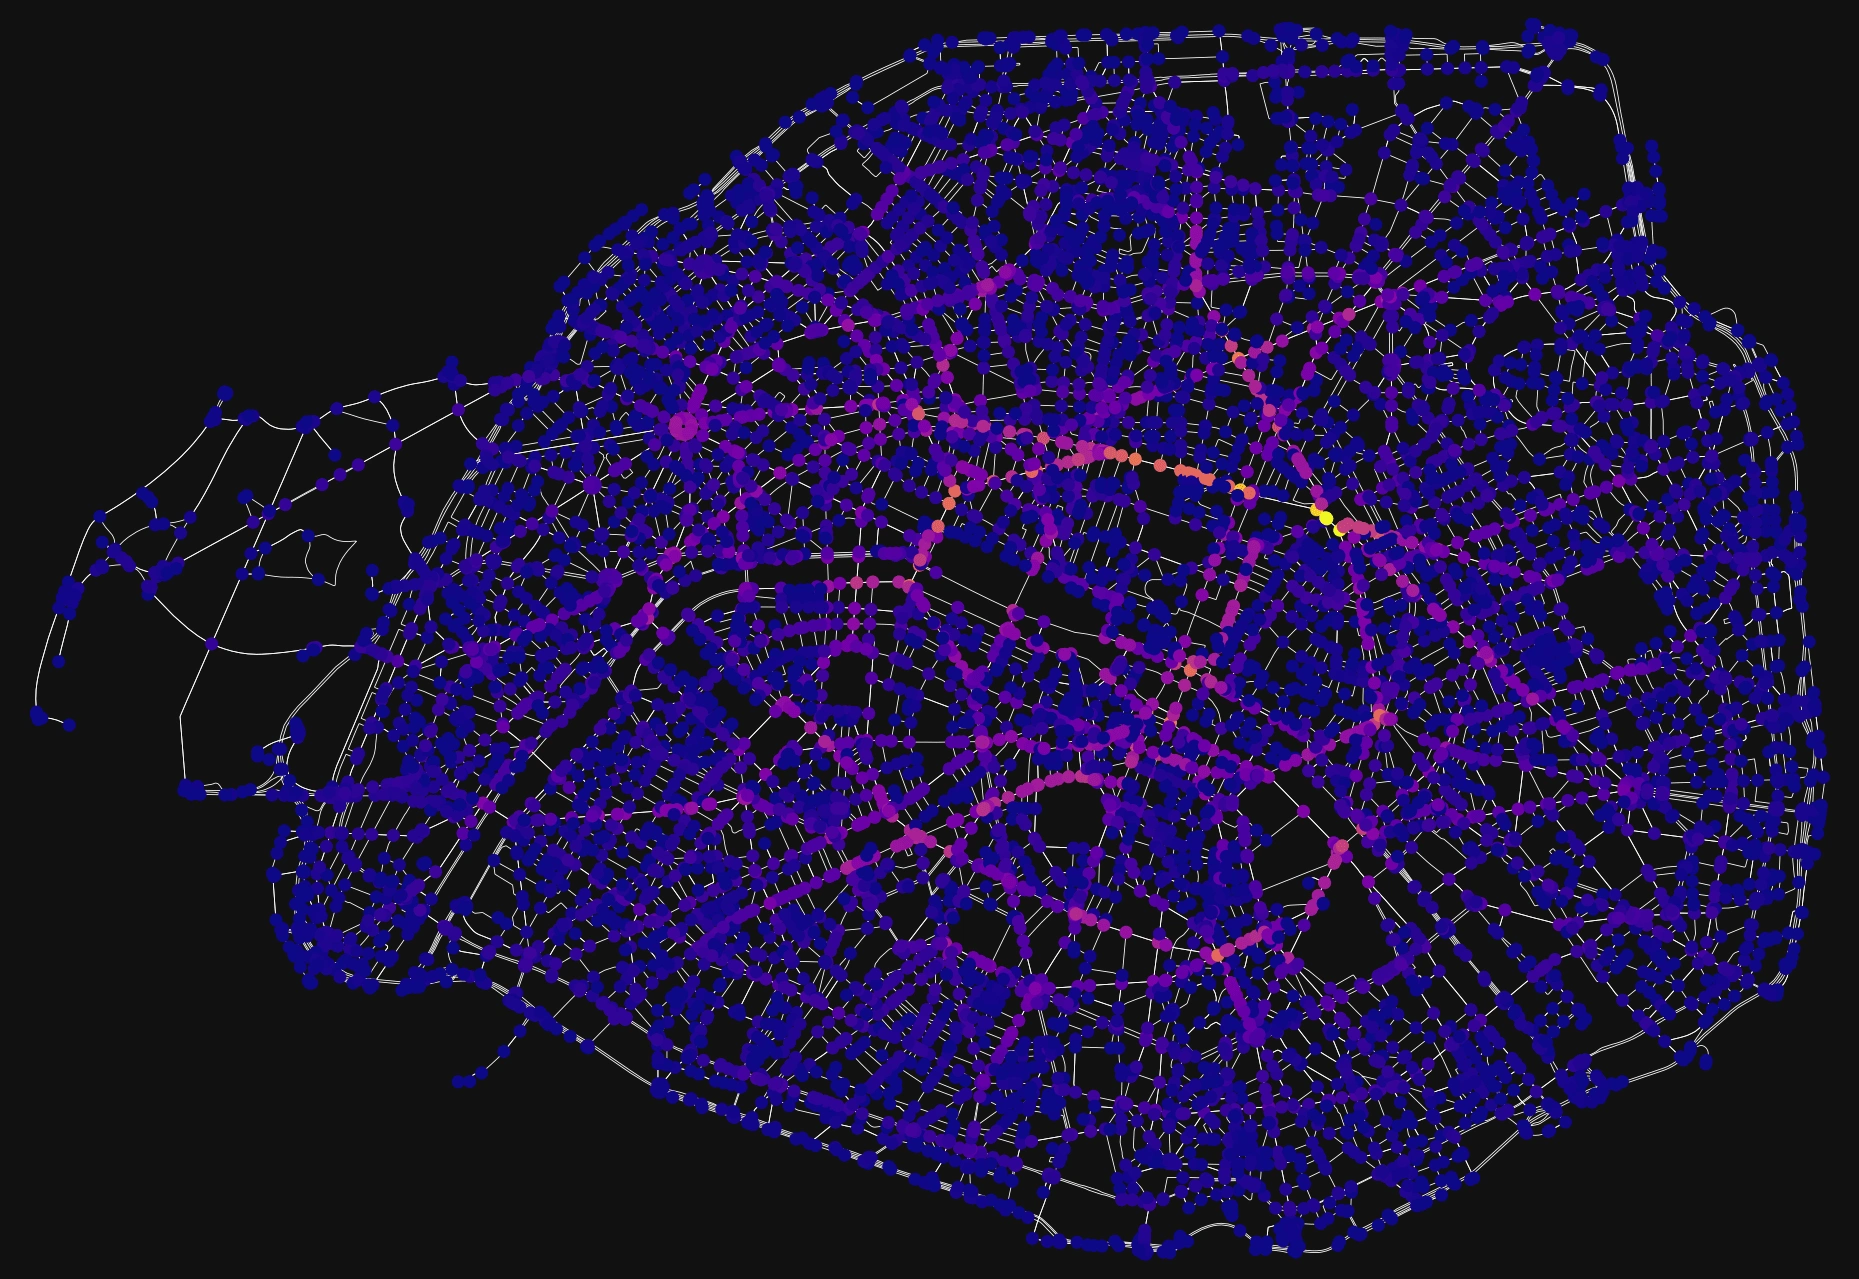
Ranked color nodes on betweenness centrality of Par
Analysis
It can be inferred that betweenness centrality (BC) is strongly related to the degree of the node. One more observation we can have is that, though Paris has central planning in place, it does have its limitations as it has not prevented Paris from having high BC, the planning has just aided in redirecting the flow. The study of high BC nodes is prominent as it helps to identify the bottlenecks in networked systems, this information will be useful for urban planners and researchers.
Analyzing the betweenness centrality through the above images helps us to identify areas with the least centrality are in blue and slowly as the centrality values increase the contrast will go up until yellow which has the highest centrality in the drivable network. When the BC value is maximum, it means that the intersection or the node is almost saturated and it will not be able to handle the traffic as it exceeds the node capacity.
Code on Github🟥 :https://github.com/ayushvyas25/NetworkAnalysis/
Like this project
Posted Jul 28, 2022
Street/Road networks comparison between Oshawa,Toronto and Paris.


