DataStrides Analytics
Vinoth Kumar V
This is a fully responsive page for my client's large-scale application, DataStrides.
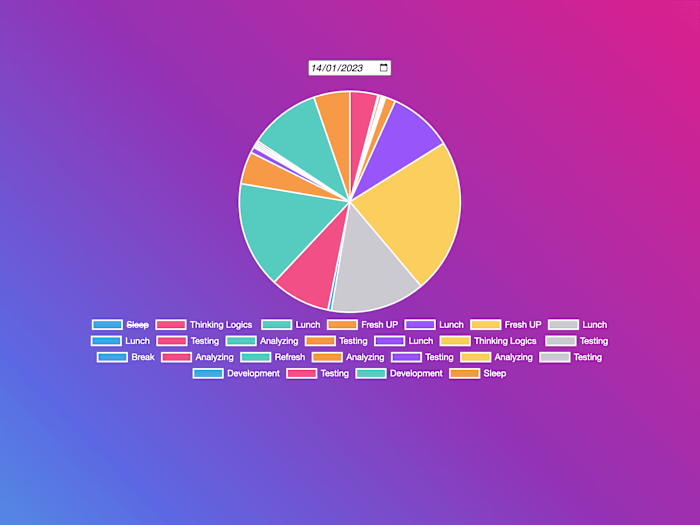
Users can upload CSV data and instantly convert it into various visual charts. You can even customize the colors to your liking.
To build this page, I've used technologies like Next.js, React Plotly, Tailwind CSS, Framer Motion, and more. And, when you're ready, you can download the charts you've created.
i'm very grateful for your time spent exploring my sample work.
If you have ideas for a custom web solution like this, share them with me. Together, we can turn your vision into a stunning reality!
Like this project
Posted Oct 13, 2023
Hi, Welcome to this demo of my sample work! I've created a fully responsive page for my client's large-scale application, DataStrides. Users can upload CSV d…
Likes
0
Views
19