ABC Inventory Analysis
Elliot Manuel Sithole
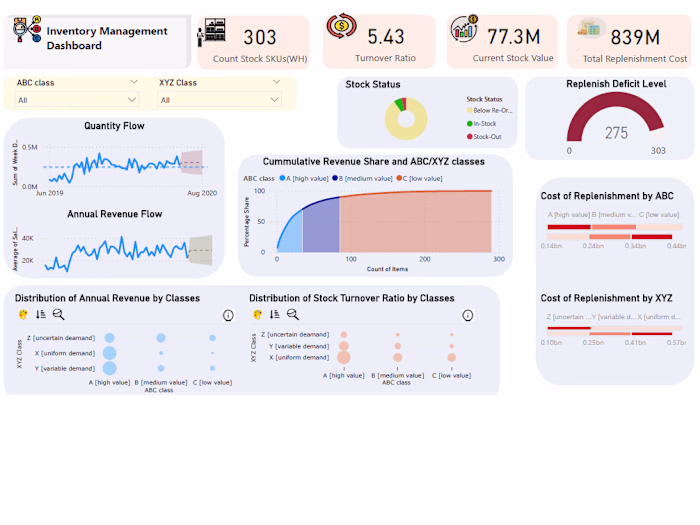
I created an interactive ABC Inventory Dashboard, analyzed inventory data, and identified and categorized high-value items (A), moderate-value items (B), and low-value items (C). Firstly, this classification allowed for strategic narrowing down with exploratory data analysis and then later explanatory data analysis for decision-making.
Data Collection and Preprocessing with Python:
ABC Analysis Calculation with Python:
Visualization and Analysis with Power BI:
Dashboard Creation in Power BI:
Iterative Refinement and Optimization:
Like this project
Posted Feb 15, 2024
I crafted actionable insights for evidence-informed decisions using advanced data analytics to perform ABC inventory analysis with an interactive dashboard.
Likes
0
Views
6