Superstore Sales Analysis Dashboard Development

Akriti Saha

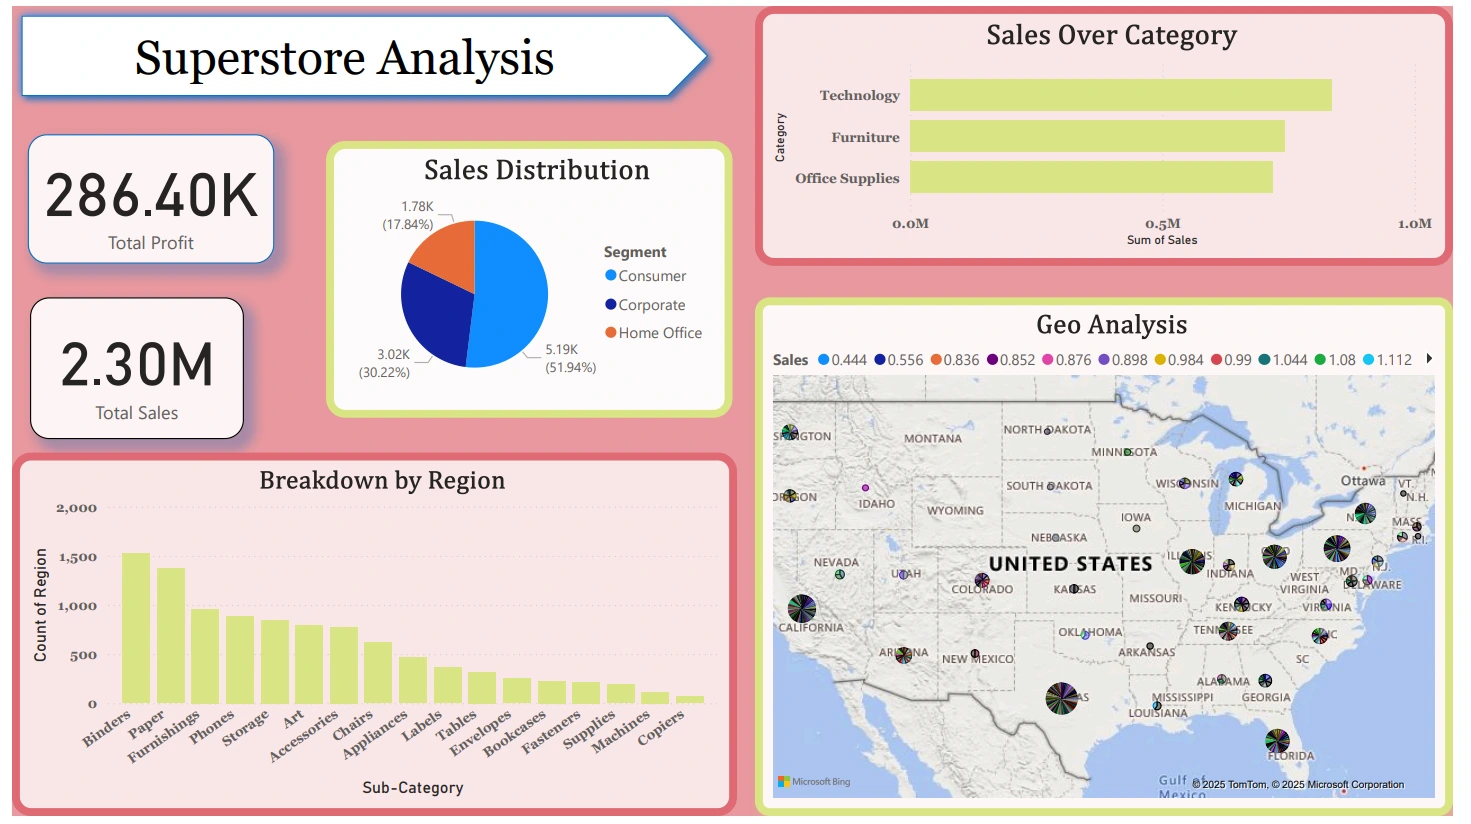
• Designed and developed an interactive Superstore Sales Analysis dashboard in Power BI, enabling real-time insights into sales, profit, and customer segments.
• Implemented dynamic filters and visual breakdowns by category, region, and ship mode to support strategic decision-making.
• Identified that the Consumer segment contributed 52% of sales, and Binders were the highest ordered sub-category among 2,323 total orders.
Like this project
Posted Jul 31, 2025
Created a Power BI dashboard for Superstore Sales Analysis.
Likes
0
Views
0