3D Electric Field Visualization Project
Dariush Samari
3D Electric Field Visualization
A web-based simulation that visualizes electric field lines, vectors, and related numeric values for a dipole charge configuration using Three.js.
Overview
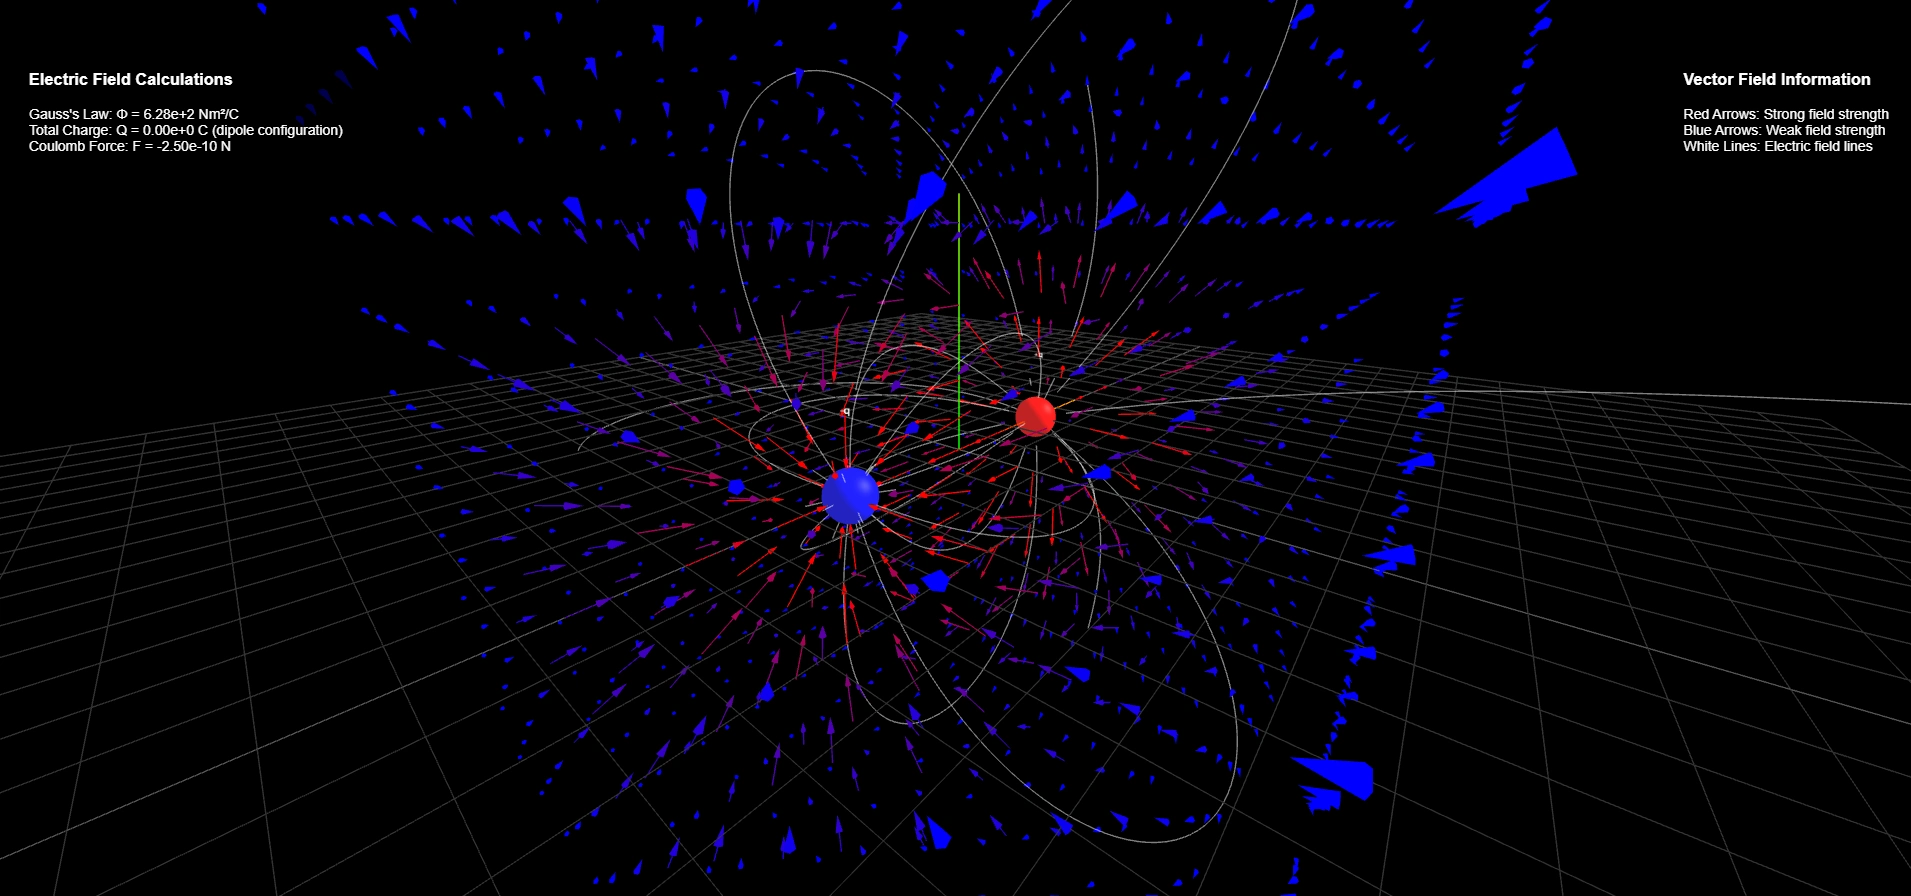
This project renders a 3D scene with two opposite point charges (+q and –q) and dynamically displays:
Field lines traced by numerical integration of Coulomb’s law.
Field vectors as arrows colored by direction and scaled by magnitude.
Numeric panels showing Gauss’s law flux, total charge, and Coulomb force between the charges.
All UI panels and HTML elements are generated dynamically in
index.html.Demo
To launch the simulation locally:
Features
Dynamic field-line tracing: Smooth integration of field vectors into continuous lines.
Arrow helpers: Colored arrows (blue to red gradient) representing field strength and direction.
Live numeric displays: Real-time calculation of electric flux, net charge, and Coulomb force.
Interactive camera: Orbit, pan, and zoom using Three.js
OrbitControls.Responsive design: Canvas and UI adjust automatically on window resize.
Prerequisites
Modern web browser with ES module support (Chrome, Firefox, Edge, Safari).
Local HTTP server (e.g., Python 3.x, Node.js
http-server).Installation & Setup
Clone this repository:
Serve the files:
Open the simulation:
Navigate to
http://localhost:8000/index.html in your browser.File Structure
Configuration
Inside the
<script type="module"> block at the top of index.html, you can adjust:Modifying these values will change the density, length, and appearance of the visualization.
Dependencies
Three.js via ES modules
OrbitControls addon for camera interaction
es-module-shims for import map support (if needed)
Contributing
Fork the repository.
Create a feature branch:
git checkout -b feature/YourFeatureCommit your changes:
git commit -m "Add YourFeature"Push to your branch and open a Pull Request.
License
This project is released under the MIT License. Feel free to use, modify, and distribute as you see fit.
Like this project
Posted Jul 17, 2025
A web-based simulation that visualizes electric field lines, vectors, and related numeric values for a dipole charge configuration using Three.js.