
Project Introduction
In this project, my team and I were consulted by a major footwear manufacturer because they wanted to learn more about their customers in order to increase sales and ultimately advance their business. A couple of outcomes our client would like to see by the end of the project are:
know more about their current customers
understand where they stand with potential competitors
tap on opportunities
predict future trends
To achieve the above-mentioned outcomes, my team and I were asked to draw an ER diagram for the new database that stores all the data we might need and some SQL queries that will give the manufacturer a better understanding of their current market.
Thought Process & What We Did
With that being said, we listed out some data that we might need:
Customer profile data to understand basic information of current customers such as age, demographics, and how much each customer spend on average
Shoe sales data including online sales and in-store purchases
Customer reviews data such as the average review rating per shoe category to see if there's any shoe category that is extremely popular or unpopular
And here's the ER diagram:
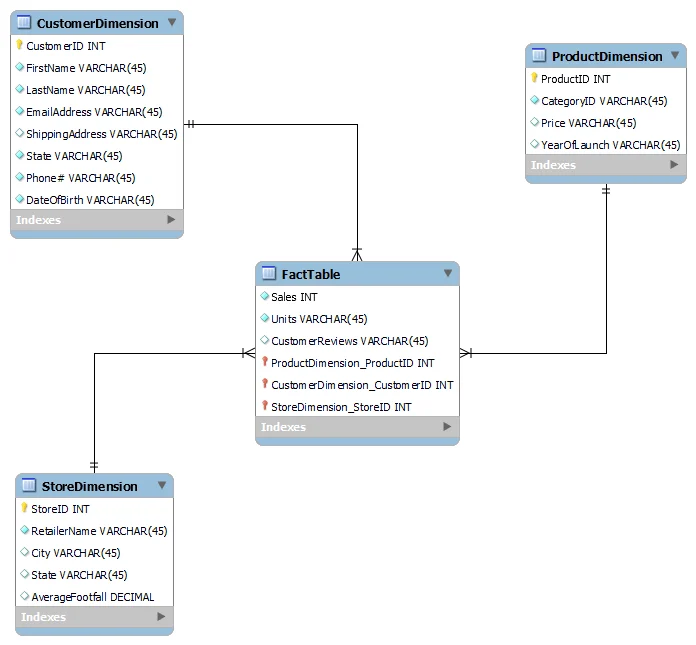
We decided to use star schema for our database. We created a Customer Dimension to store all customer information, a Product Dimension that includes price, category, and year of launch, and a Store Dimension that stores the retailer name assuming our client brand is being sold at retailers as well.
Now we've created the database, it's time for us to write SQL queries that will help our client achieve their goals:
To know the best-selling shoe category across different age groups
SELECT
AgeGroup,
Category,
Total_Units
FROM
(SELECT
pd.CategoryID AS Category,
SUM(ft.Units) AS Total_Units,
CASE
WHEN TIMESTAMPDIFF(YEAR, CURDATE(), cd.DateOfBirth) < 21 THEN 'Under 20'
WHEN TIMESTAMPDIFF(YEAR, CURDATE(), cd.DateOfBirth) < 31 THEN '21-30'
WHEN TIMESTAMPDIFF(YEAR, CURDATE(), cd.DateOfBirth) < 41 THEN '31-40'
WHEN TIMESTAMPDIFF(YEAR, CURDATE(), cd.DateOfBirth) < 51 THEN '41-50'
ELSE '50+'
END AS AgeGroup
FROM
FactTable ft
JOIN ProductDimension pd ON pd.ProductID = ft.ProductID
JOIN CustomerDimension cd ON cd.CustomerID = ft.CustomerID
GROUP BY AgeGroup , Category
ORDER BY AgeGroup , Total_Units DESC) sub
GROUP BY AgeGroup;
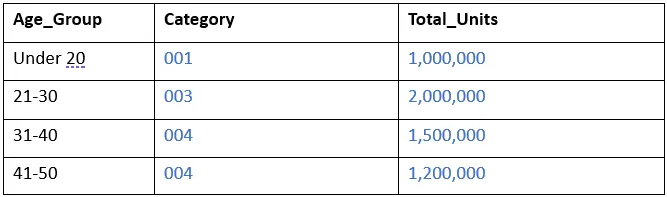
Sample output. We can see which shoe category is the most popular in each age group and better target customers in different age groups with products they will enjoy.
To know which retail chain generates the most revenue for the client brand
SELECT
sd.RetailerName,
SUM(ft.Sales) AS Sum_Sales
FROM
FactTable ft
JOIN StoreDimension sd ON sd.StoreID = ft.StoreID
GROUP BY RetailerName
ORDER BY Sum_Sales DESC;
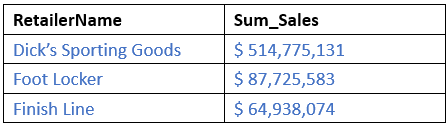
Sample output. After understanding the retailers that have higher sales than others, we can recommend putting more effort towards those retailers such as sending a higher volume of products or even exclusive shoes (limited edition, rare, etc) to them.
To know if the year of launch influences sales within certain age groups
SELECT
CASE
WHEN TIMESTAMPDIFF(YEAR, CURDATE(), cd.DateOfBirth) < 21 THEN 'Under 20'
WHEN TIMESTAMPDIFF(YEAR, CURDATE(), cd.DateOfBirth) < 31 THEN '21-30'
WHEN TIMESTAMPDIFF(YEAR, CURDATE(), cd.DateOfBirth) < 41 THEN '31-40'
WHEN TIMESTAMPDIFF(YEAR, CURDATE(), cd.DateOfBirth) < 51 THEN '41-50'
ELSE '50+'
END AS Age_Group,
CASE
WHEN TIMESTAMPDIFF(year, curdate(), pd.YearOfLaunch) <5 THEN "<5"
WHEN TIMESTAMPDIFF(year, curdate(), pd.YearOfLaunch) <10 THEN "5-10"
WHEN TIMESTAMPDIFF(year, curdate(), pd.YearOfLaunch) <20 THEN "10-20"
WHEN TIMESTAMPDIFF(year, curdate(), pd.YearOfLaunch) <30 THEN "20-30"
ELSE "30+"
END AS ShoeAge,
ft.Sales
FROM
FactTable ft
JOIN ProductDimension pd ON pd.ProductID = ft.ProductID
JOIN CustomerDimension cd ON cd.CustomerID = ft.CustomerID
GROUP BY AgeGroup, ShoeAge
ORDER BY AgeGroup;
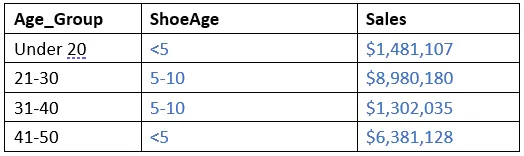
Sample output. We can see if a certain age group prefers vintage/classics or newly released shoes, and hence using social media campaigns to target different age groups based on their preferences.
To know if online stores generate more sales or if retail stores do
SELECT
City,
Store_Type,
Sales,
Total_Sales,
Sales/Total_Sales as Sales_Contribution
FROM
(SELECT
City,
CASE
WHEN StoreID = 0 THEN 'Online'
ELSE 'Retail'
END AS Store_Type,
SUM(sales) as Sales
FROM
FactTable as ft
INNER JOIN StoreDimension as sd
GROUP BY City, Store_Type) AS a
INNER JOIN
(SELECT
City,
SUM(sales) as Total_Sales
FROM
FactTable as ft
INNER JOIN StoreDimension as sd
GROUP BY City) AS b ON a.City = b.City;
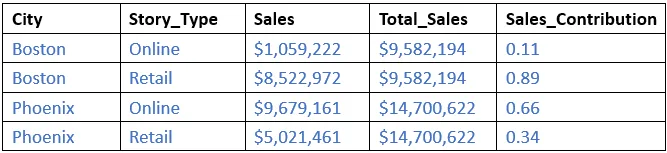
Sample output. We can see how each city is doing online and in retail, and potentially rethink the marketing strategy to bring in more revenue.
Conclusions
Through the information provided by our SQL queries, our client gets to thoroughly understand their customers based on age groups, sales differences between different retailers and cities.
Marketing campaigns targeting different age groups can further be created to increase sales or even buzz around a certain shoe type/ pair of shoes. Our client gets to see if the retailers are potential competitors, or if they are doing significantly better online or in-store.
0 likes · 76 views · Dec 16, 2021
