Network Intrusion Detection Through Graph Structure

Mangesh Bhattacharya


Network Intrusion Detection Through Graph Structure
Final project for our Complex Networks course. Four of us spent the semester asking a simple question: if you stop looking at network traffic as a spreadsheet of isolated flows and start looking at it as a graph, does an attacker's shape in that graph give them away?
Short answer: yes, for a meaningful chunk of them - and the "why" turned out to be more interesting than the accuracy number.
Why we built this
Most intrusion detection tutorials treat each network flow as a row in a table and train a classifier on packet counts, byte counts, duration, that sort of thing. That throws away something free: who talked to whom. An IP address that suddenly starts fanning out connections to hundreds of other machines is doing something structurally different from one having a normal conversation with a mail server, even before you look at a single packet's contents.
So we rebuilt the same intrusion-detection problem as a graph problem:
Nodes = IP addresses
Edges = the fact that two IPs exchanged at least one flow
Edge attributes = packet/byte counts, duration, protocol, flow count
Node label = did this IP ever touch a flow labeled as an attack?
Then we asked what centrality, motif, and embedding features can tell us about attacker behavior that raw flow statistics can't - and whether that signal is strong enough to actually help a classifier.
The concept, visually
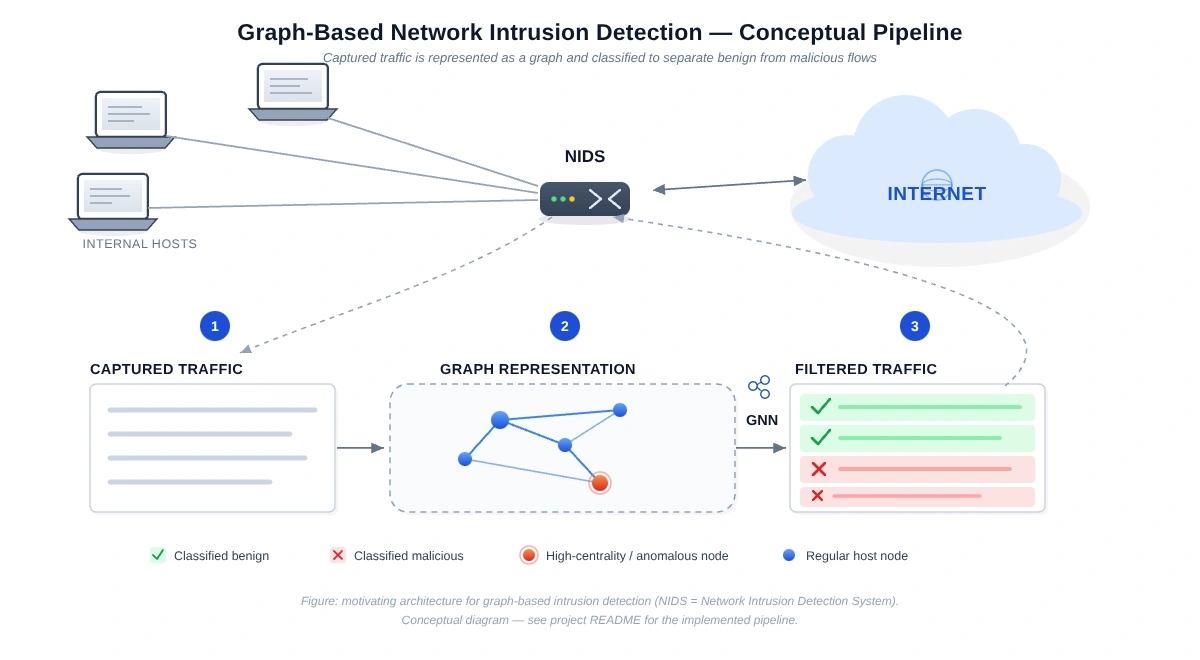
This diagram is the textbook version of the idea above: a NIDS sits inline between the LAN and the internet, captures traffic, represents it as a graph, and uses a graph neural network (GNN) to decide what to let through. It's the concept that motivated the whole project - traffic-as-a-graph instead of traffic-as-a-spreadsheet
and it's worth including because it explains why graphs are the right lens here: structural position in a communication graph (who a node talks to, how central it is, whether it clusters with other suspicious nodes) carries information that per-flow statistics alone don't.
It is not a picture of what we actually built, and we want to be upfront about that rather than let the diagram overstate our scope:
It shows live, inline filtering at the router. Our pipeline is offline: we build a graph from a flow-log snapshot (or a pre-built Kaggle graph), extract features, and classify after the fact - see How the graph gets built.
It shows a GNN doing the classification. We used Node2Vec embeddings feeding Random Forest / XGBoost instead; GCN/GraphSAGE/GAT were part of the original plan but cut for practical reasons - see What we deliberately left out.
Think of this image as the "north star" architecture and the flowchart later in this README as the "what we actually shipped" version.
What we found (the short version)
Is the network graph hub-dominated?: Yes - one node touches ~30% of all edges; 95.8% of nodes have degree exactly 1
Do attackers hide on the busiest nodes?: No. The top 5 hubs by degree touch zero attack-labeled edges
Are triangles (3-way mutual connections) common?: Rare - only 47 in a 41,073-node graph, touching 0.13% of nodes
Does nx.clustering() run on a graph this size?: Not in any reasonable time - we derive it from triangle counts instead (verified identical)
Does Node2Vec run on the full graph?: No - same mega-hub problem. We scope it to the 962-node neighborhood around attack activity
Do graph features actually help detection?: Random Forest / XGBoost hit 0.92-0.96 accuracy, 0.93-0.96 ROC-AUC vs. a 0.50 ROC-AUC majority-class baseline
Which features mattered most?: Node2Vec embedding dimensions - ahead of every hand-built centrality feature
The full reasoning, numbers, and sanity checks for each of these live in the notebooks - see Notebooks below. We're intentionally not just dumping a big accuracy number here; the point of this project was understanding why the graph looks the way it does before trusting any model built on top of it.
Datasets
Kaggle "0.1M-Stratified" graph: A pre-built graph derived from 100,000 sampled NetFlow records, shipped in three edge-handling variants (plain / aggregated / multi), notebooks/01_...kaggle.ipynb - our main feature-extraction and modeling notebook
We also looked at CIC-IoT-2023, UNSW-NB15, TON_IoT, and Bot-IoT while scoping the project, but didn't end up using them - IoT-specific and heavier real-time dataset choices weren't a good fit once we'd committed to the flow-log + graph approach above.
How the graph gets built
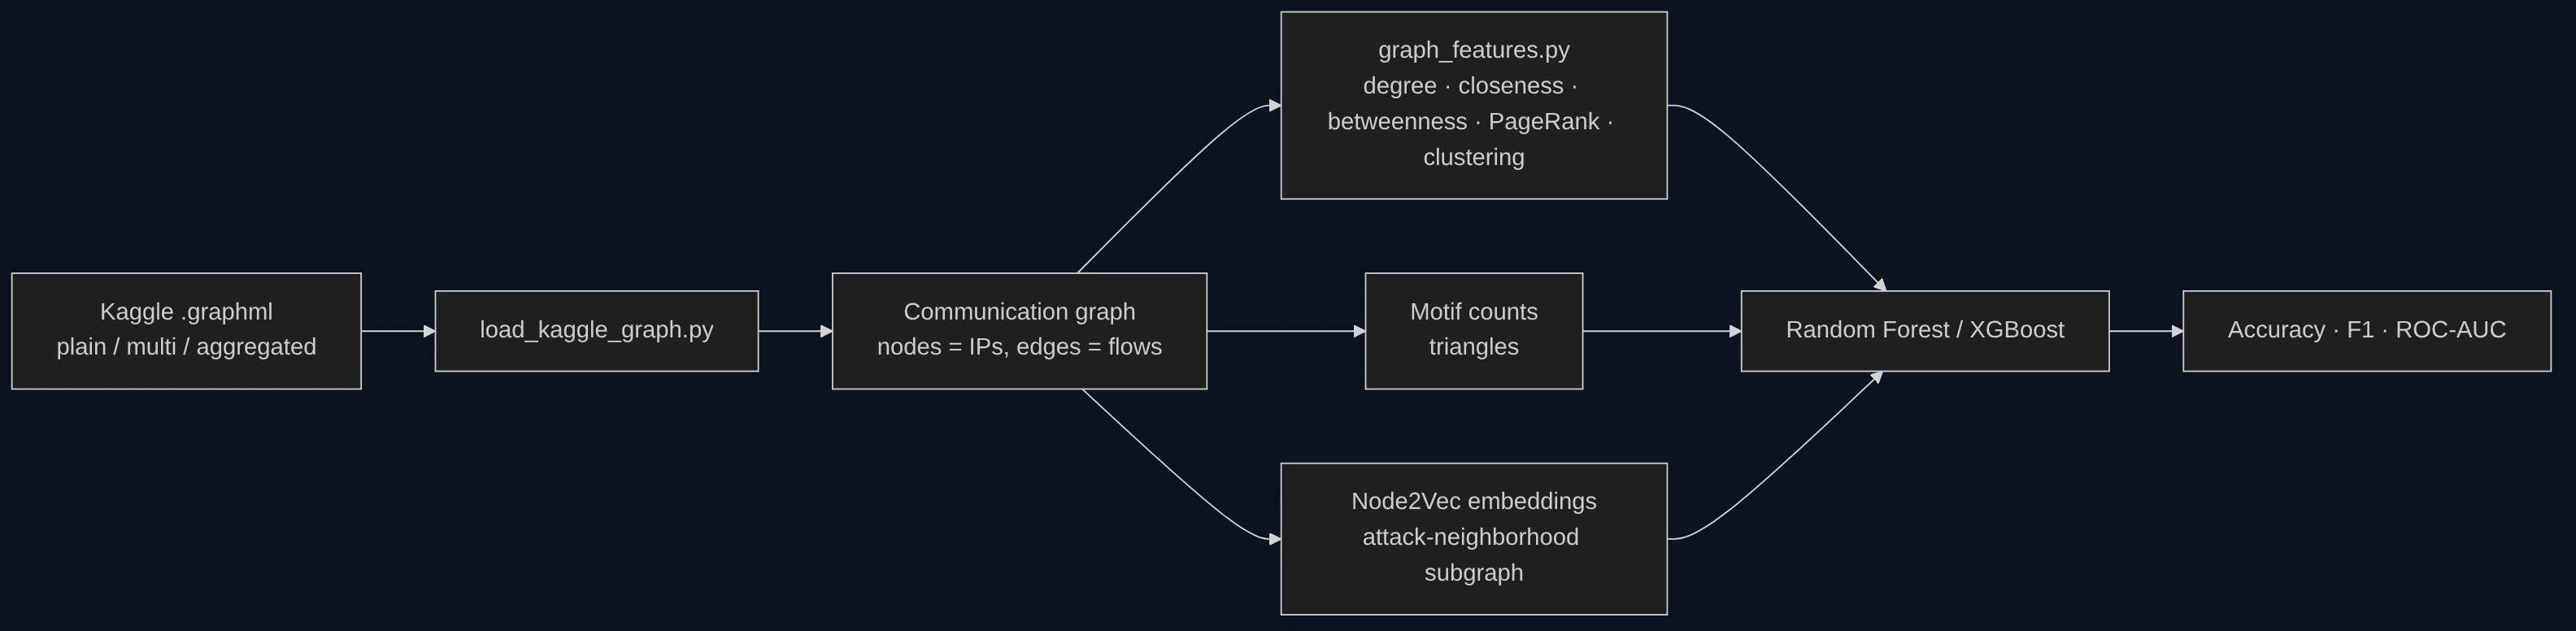
Every one of those arrows is a real, runnable step in the notebooks - nothing here is a mockup. Where the straightforward approach didn't scale (looking at you, nx.clustering() and full-graph Node2Vec), we say so in the notebook, explain why, and show the workaround plus proof that it gives the same answer.
Notebooks
01_graph_construction_and_visualization_kaggle.ipynb: Loading the Kaggle graph variants, degree/closeness/betweenness/PageRank, motif counts + derived clustering coefficient, Node2Vec embeddings, Random Forest / XGBoost models, feature importance
Source
src/graph_construction.py: Flow logs -> communication graph; chunked label-aware sampling so we don't accidentally build an "attack graph" out of zero attacks; time-windowed aggregation
src/graph_features.py: Degree/closeness/betweenness centrality, PageRank, clustering coefficient, plus verification checks (sum(degrees) == 2 edges, etc.)
src/load_kaggle_graph.py: Loads and compares the three pre-built Kaggle .graphml variants
src/visualize.py: Readable graph plots that auto-sample large graphs instead of rendering an unreadable hairball, plus feature-distribution histograms
Repository layout
Getting it running
A couple of things worth knowing before you run it:
numpy is pinned below 2.0 - some node2vec/gensim wheels aren't built against the numpy 2.x ABI yet, and this pin is the known-good combination across Windows, macOS, and Linux.
torch / torch-geometric are CPU-only requirements here; nothing in this repo needs a GPU. If the default torch wheel is a large download on your connection, install the CPU-only build directly: pip install torch --index-url https://download.pytorch.org/whl/cpu.
The GNN models mentioned in the Methods section below (GCN, GraphSAGE, GAT) are listed as part of the original project scope, but we ended up not implementing them.
Methods
Graph construction
Build an undirected communication graph from flow logs or from the pre-built Kaggle graphs
Aggregate repeated flows between the same pair of IPs into weighted edges (flow count, total packets, total bytes, attack-flow count)
Optional time-windowing for temporal analysis
Feature extraction
Degree, closeness, and betweenness centrality
PageRank
Clustering coefficient (derived from triangle counts when the direct computation doesn't scale - see the notebook for why and the check that proves it's the same number)
Triangle / motif counts
Node2Vec structural embeddings
Modeling
Random Forest and XGBoost, evaluated with accuracy, F1, and ROC-AUC against a majority-class baseline
What we deliberately left out
GCN, GraphSAGE, and GAT were part of our original plan and are still listed under Methods above because they shaped how we thought about the feature set (Node2Vec in particular exists as a stand-in for a learned GNN embedding). We cut them from the final implementation for a practical reason: torch-geometric is a genuinely fragile install on Windows, and between debugging that and training three separate GNN architectures, the time cost wasn't worth it this close to the presentation deadline. Everything else in this repo runs and is verified independently of that decision - we'd rather say plainly what didn't make it in than quietly pretend the scope was smaller than it was.
Team
Built by a team of four for our Complex Networks course:
Jothi Jayaraman
Mangesh Bhattacharya
Salmaan Kuthpudeen
Vishnuprasath Sathyanarayanan
Project timeline
1-2: Dataset selection and preprocessing
3-4: Graph construction and feature extraction
5-6: ML/GNN model training
7: Visualization and analysis
8: Final report and presentation
License
About
Network-Based Intrusion Detection using Graph Features - A Complex Networks course project exploring graph construction from network flows, graph-theoretic features extraction, and ML/GNN-based intrusion detection using datasets such as CIC-IDS-2017 and Kaggle.
Topics
Resources
Readme
MIT license
Security policy
Security policy
Stars
3 stars
Watchers
1 watching
Forks
No releases published
Contributors 2 (2)


Languages
Like this project
Posted Oct 28, 2026
Turns network flow logs into communication graphs, extracts graph features and Node2Vec embeddings, and trains ML/GNN models to detect intrusions.
Likes
0
Views
0
Timeline
Jun 27, 2026 - Aug 4, 2026