After working with Excel and
Daisy Quitalig
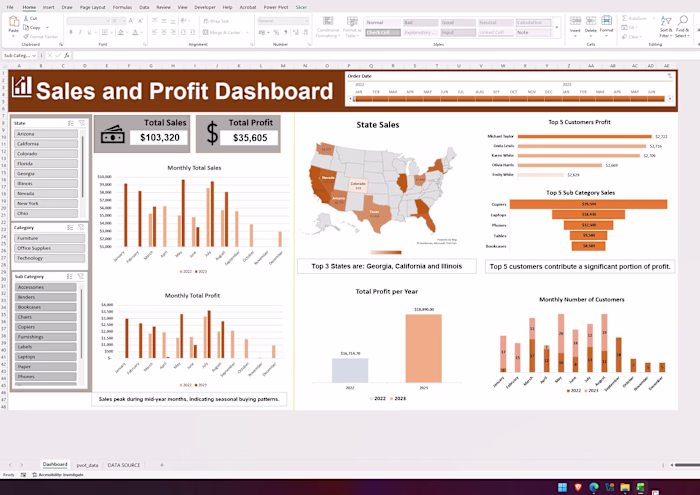
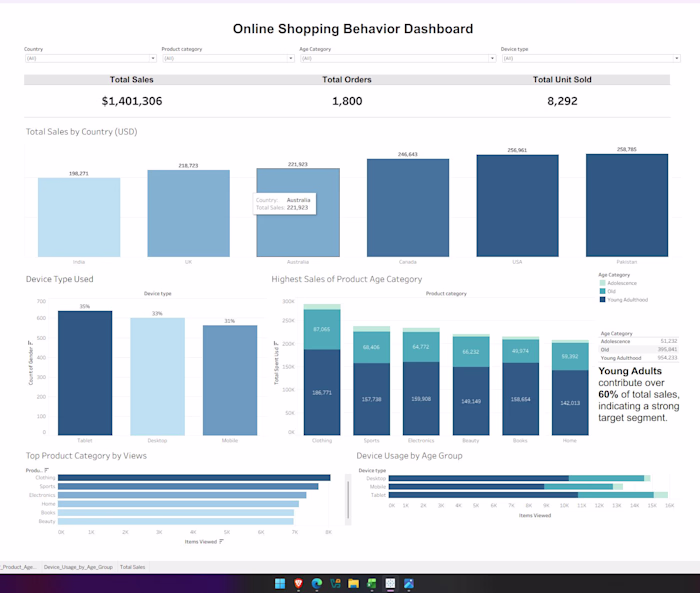
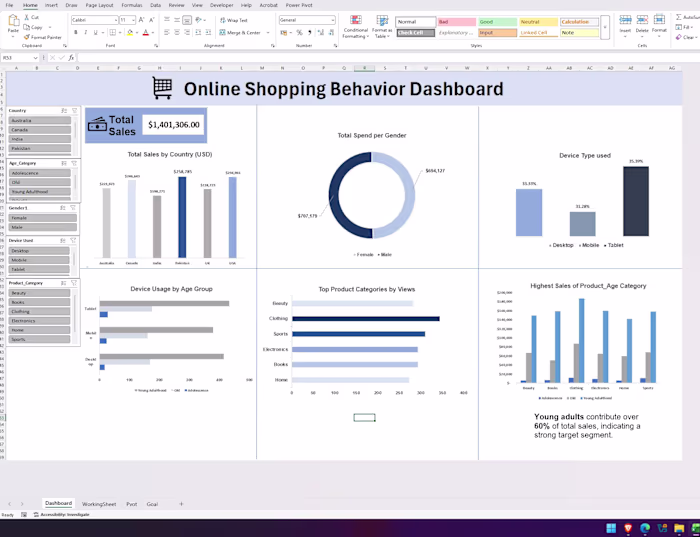
After working with Excel and Tableau, I challenged myself to build a more advanced dashboard focused on sales performance, profitability, and product trends. 😉
🔍 Key Insights:
• Total Sales reached 11M with 1.84M profit
• Electronics is the top-performing category across sales and profit
• Monthly sales show steady trends with fluctuations throughout the year
• Top products like Camera and Monitor drive strong performance
💡 What I focused on in this project:
✔ Building KPI-driven dashboards
✔ Applying data modeling and visualization in Power BI
✔ Improving data storytelling and layout design
Dataset: Kaggle - E-commerce Sales Performance
This project is part of my journey to become a Data Analyst, continuously learning through hands-on practice and self-study.
hashtag#PowerBI hashtag#DataAnalytics hashtag#DataVisualization hashtag#PortfolioProject hashtag#OpenToWork
Like this project
Posted Jun 25, 2026
After working with Excel and Tableau, I challenged myself to build a more advanced dashboard focused on sales performance, profitability, and product trends....
Likes
0
Views
0