Sales Performance Dashboard
Camelia Najafizadeh
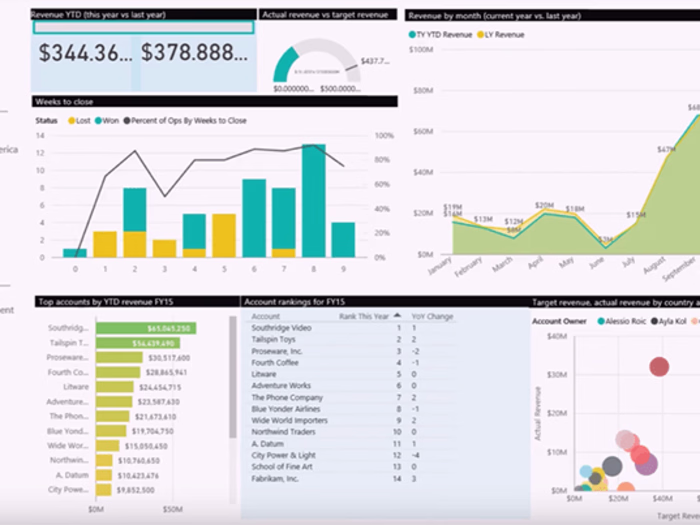
Tools Used: SQL, Power BI, Excel Objective: Create an interactive sales performance dashboard to track key metrics such as revenue, profit, customer acquisition, and sales by region. Project Steps: Data Extraction (SQL): Use SQL to extract sales data from a relational database, including tables for orders, customers, and products. Data Cleaning & Aggregation (Excel): Clean the data for inconsistencies, remove duplicates, and aggregate monthly and yearly sales data using Excel formulas and pivot tables. Data Visualization (Power BI): Design a Power BI dashboard with interactive features, allowing stakeholders to filter data by region, product category, and time period. The dashboard includes key performance indicators (KPIs) like total revenue, profit margin, and growth rate. Outcome: Provides insights into sales trends and helps the sales team make data-driven decisions on future strategy.
Like this project
Posted Oct 5, 2024
Tools Used: SQL, Power BI, Excel Objective: Create an interactive sales performance dashboard to track key metrics such as revenue, profit, customer acquisition
Likes
0
Views
1
Tags