E-commerce Sales Dashboard
Amna Surahyo
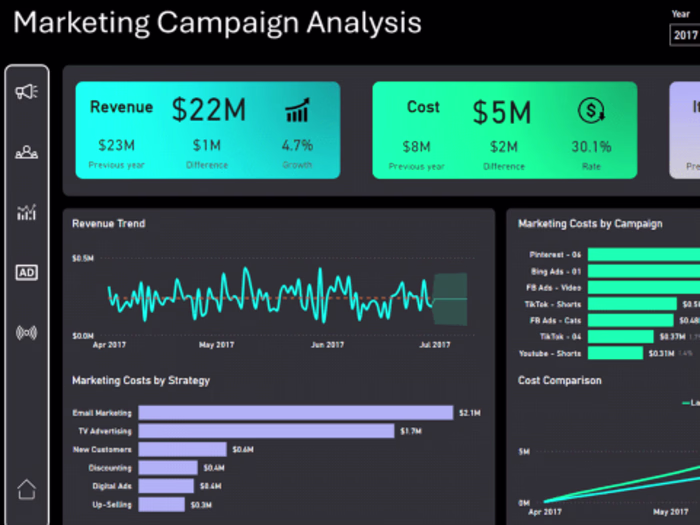
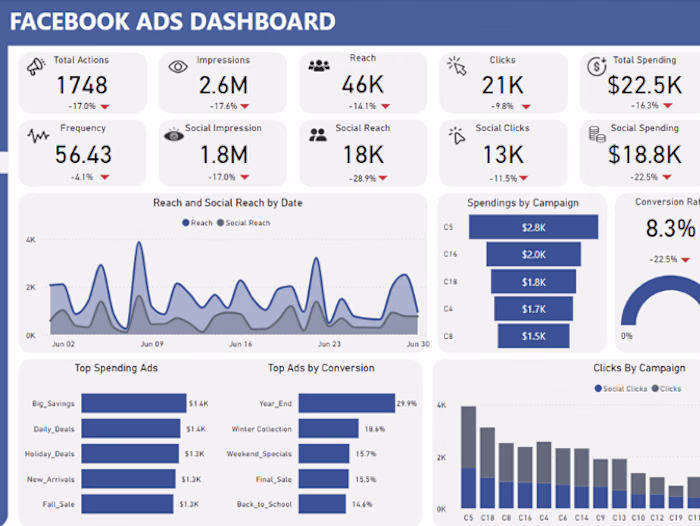
I created an interactive Power BI dashboard that visualizes key e-commerce metrics like sales, profit, and quantity sold. The dashboard features a variety of charts (bar, pie) to display sales by state, category, and customer. It also includes monthly profit trends and interactive filters for quarter-based analysis. This project demonstrates my ability to design visually appealing, data-driven dashboards that provide actionable business insights.
Like this project
Posted Sep 23, 2024
An interactive Power BI dashboard showcasing sales, profit, and quantity sold through various charts.
Likes
0
Views
0
Tags