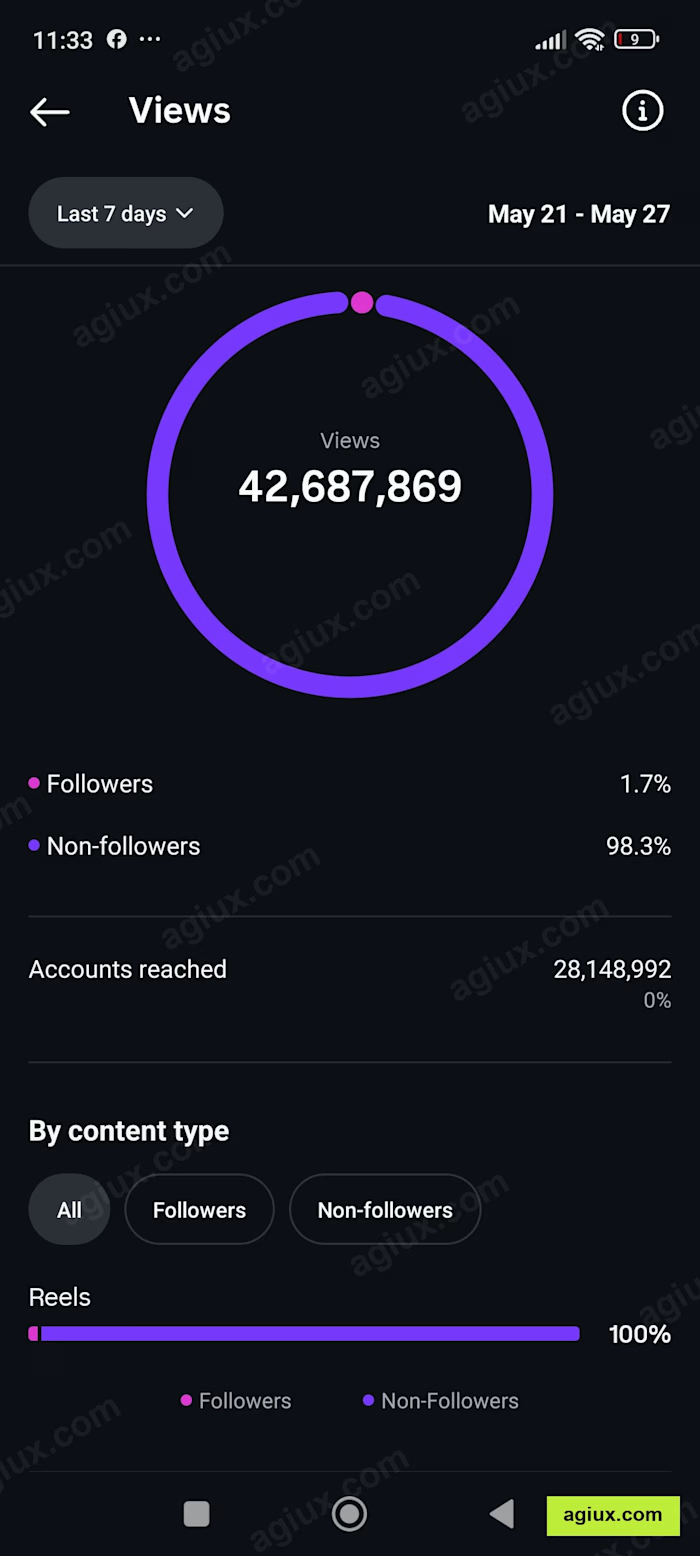
Client site: 10,159,002 sessions in 10 weeks

Mohamed HS


This is live client work, not a test. The numbers below are from the client's own Google Analytics, shared with their written permission. They have chosen not to be named, so the screenshots are the ones that show numbers rather than product names.
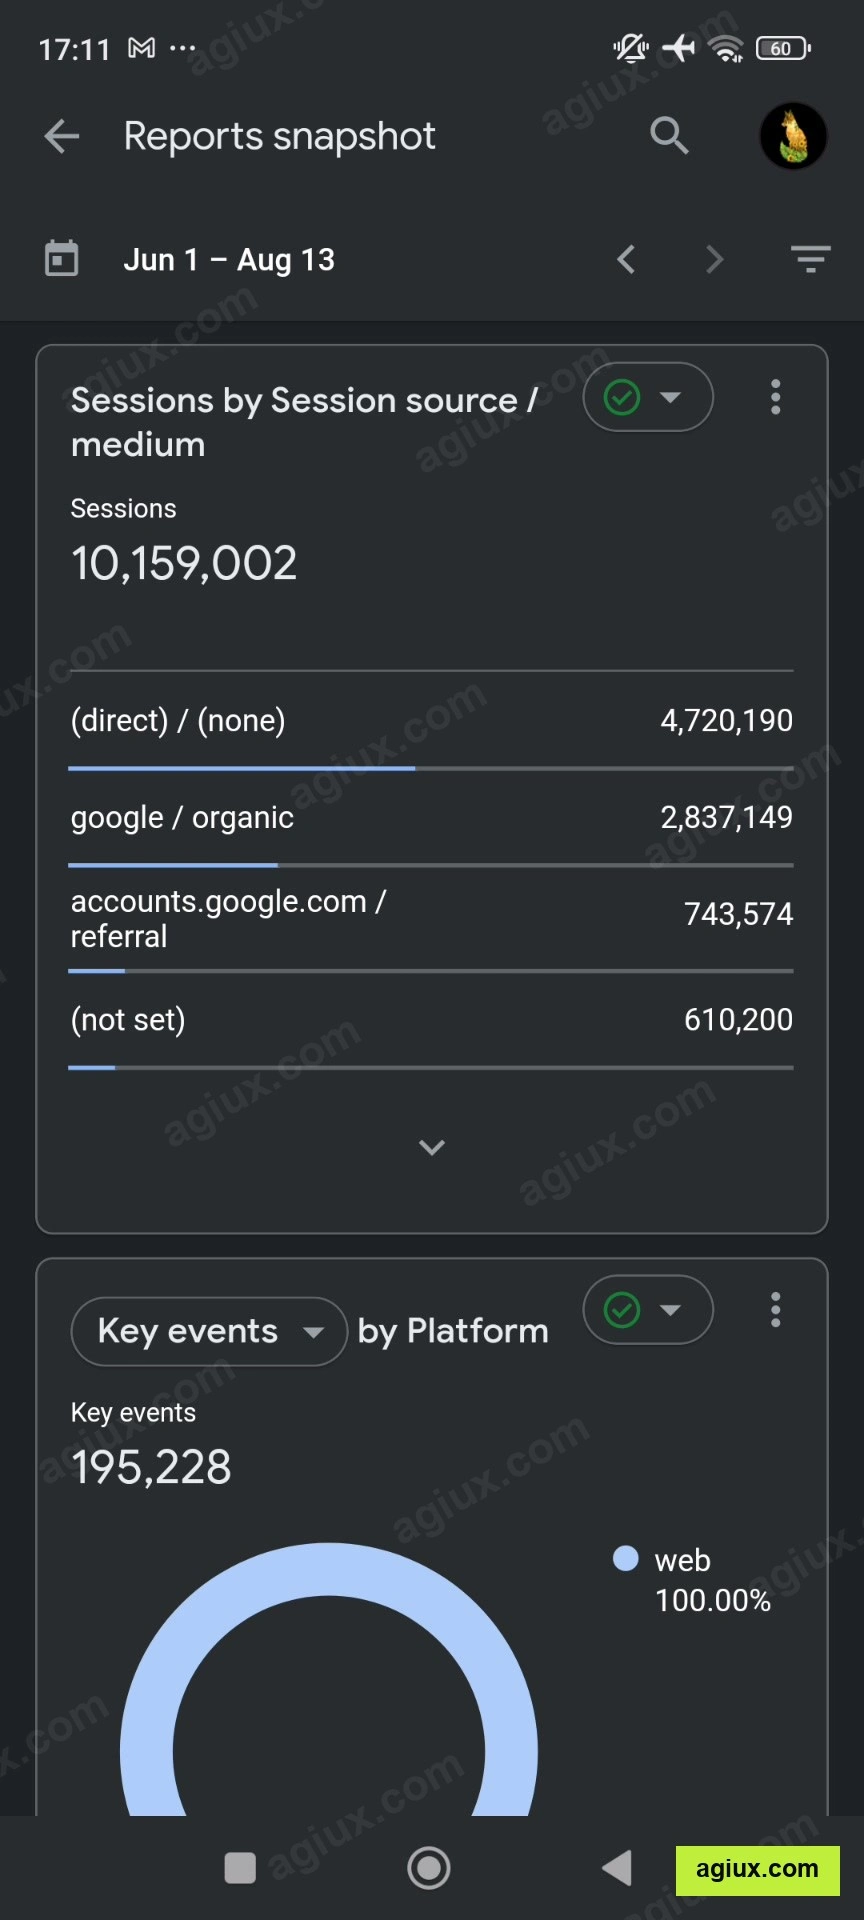
Between 1 June and 13 August
10,159,002 sessions
2,837,149 of those from Google organic
1,955,822 new users
562,413,196 events
195,228 key events
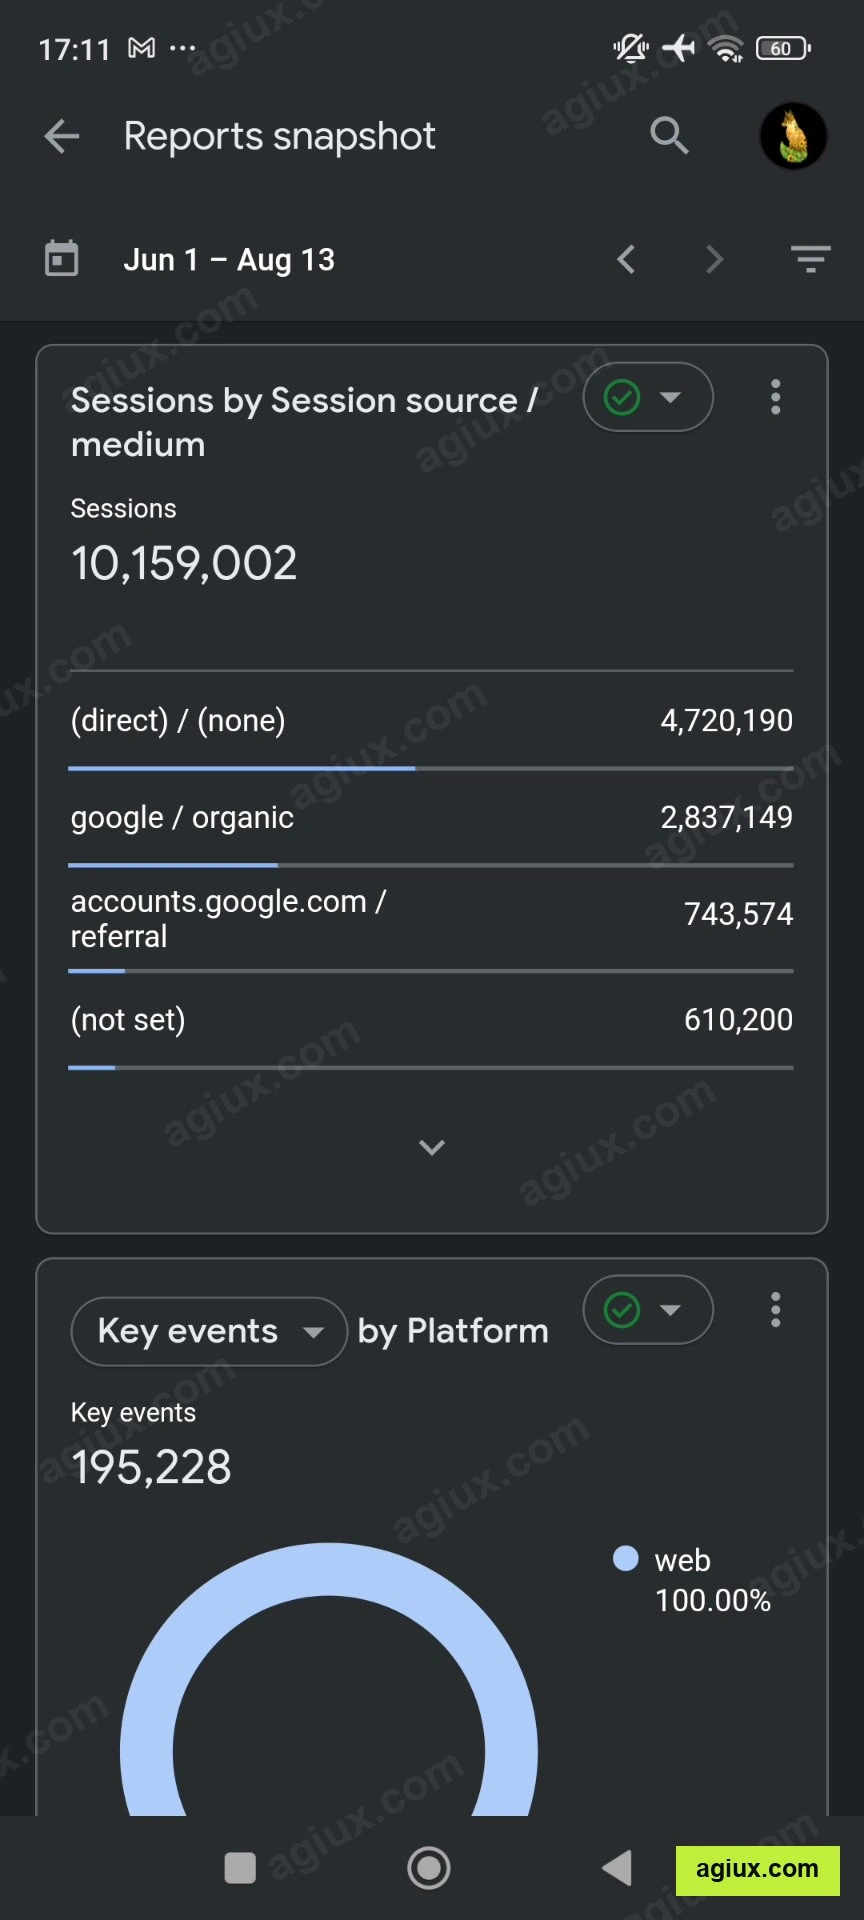
Sessions by source
Direct and organic together carry the traffic. Nothing here is paid.
One month inside that window
33,971,619 views between 14 July and 12 August, with 492K new users and 326M events.
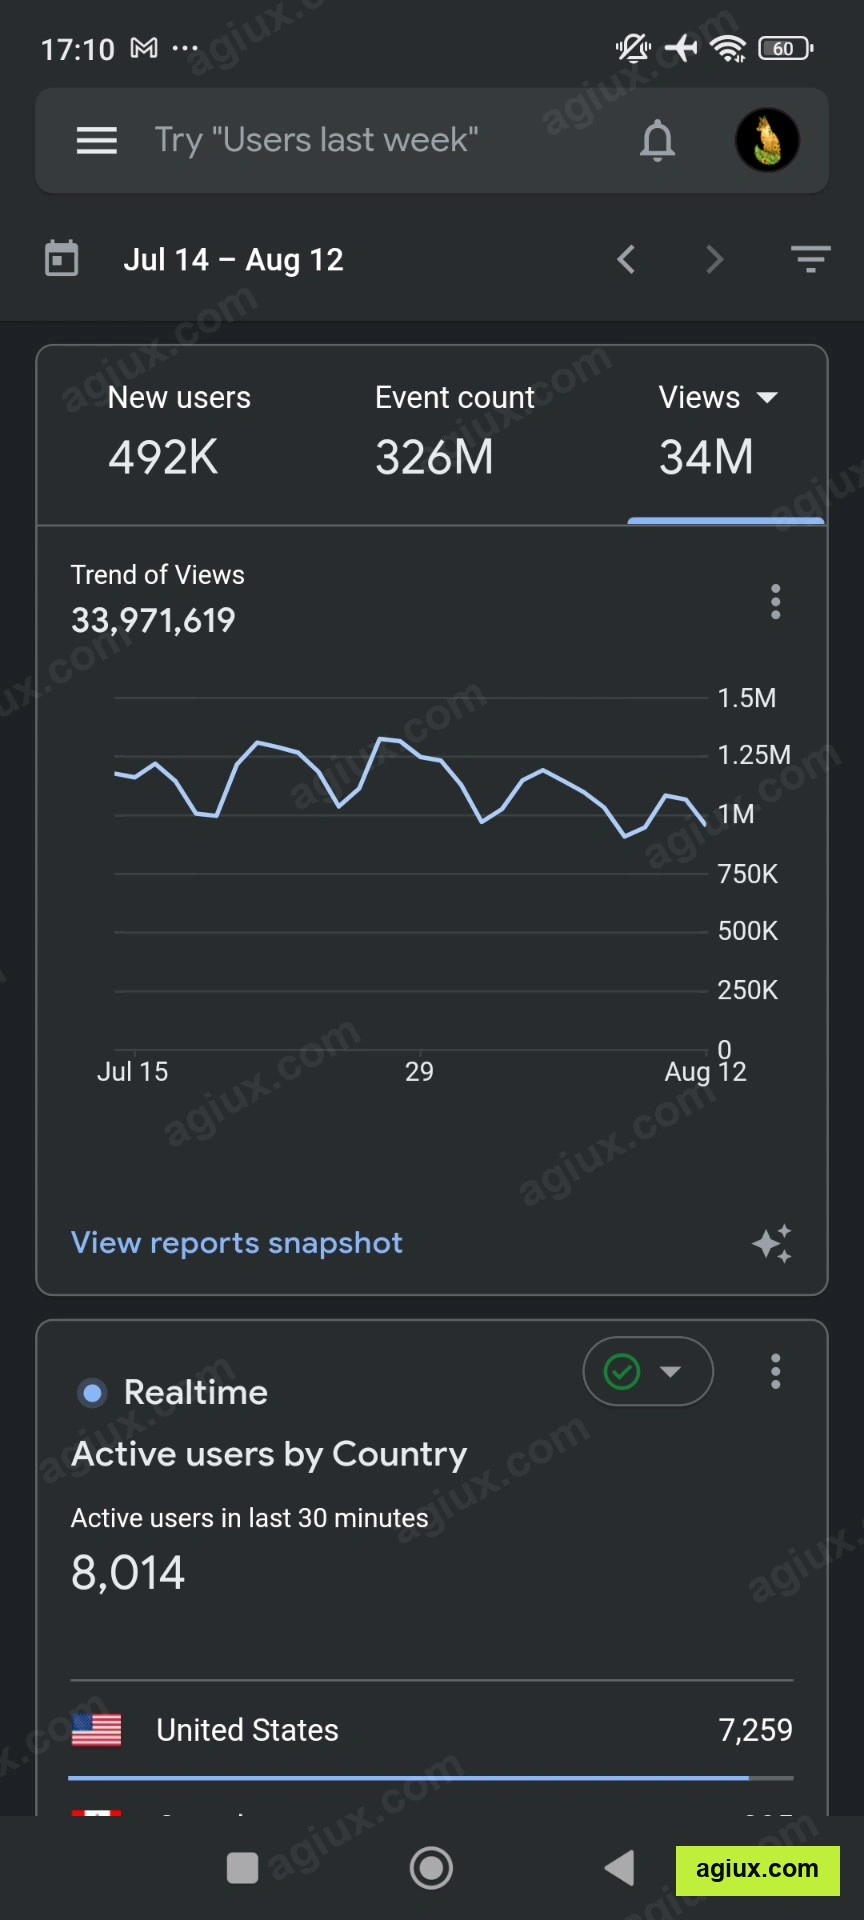
One month
One week inside that month
7,097,356 views between 6 and 12 August, 100K new users, 68.1M events. At the moment I recorded this there were 8,014 people on the site, 7,243 of them in the United States.
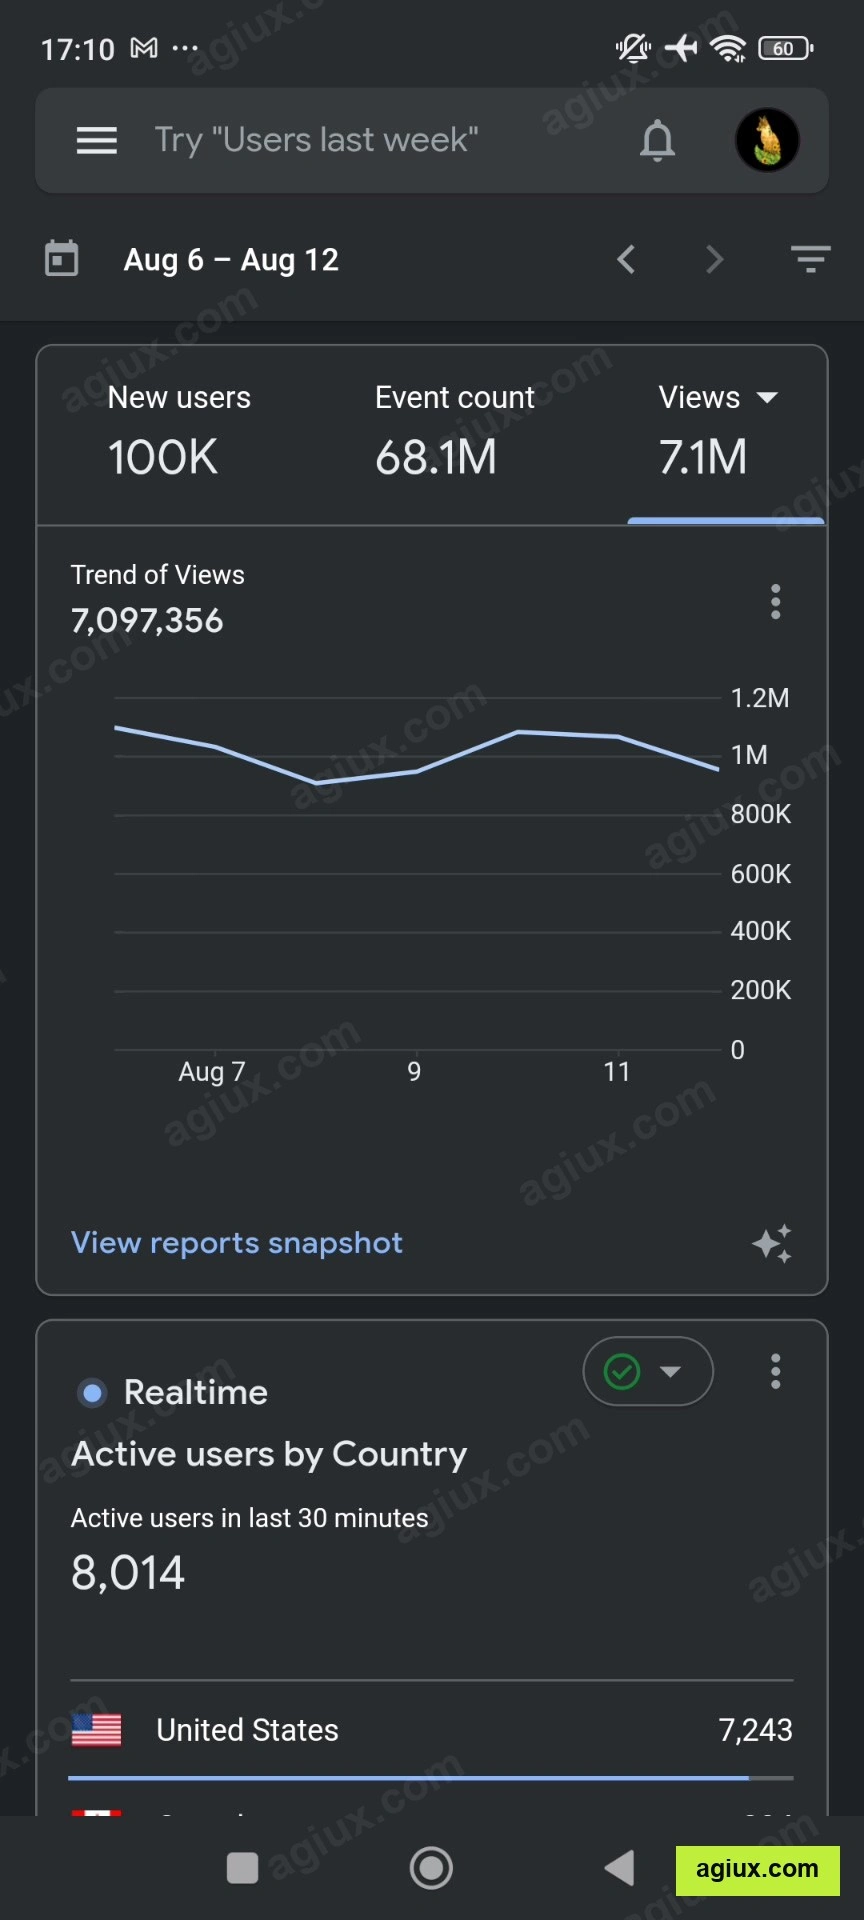
One week
The quarter in one view
1.95M active users and 562M events, with the realtime counter running alongside it.
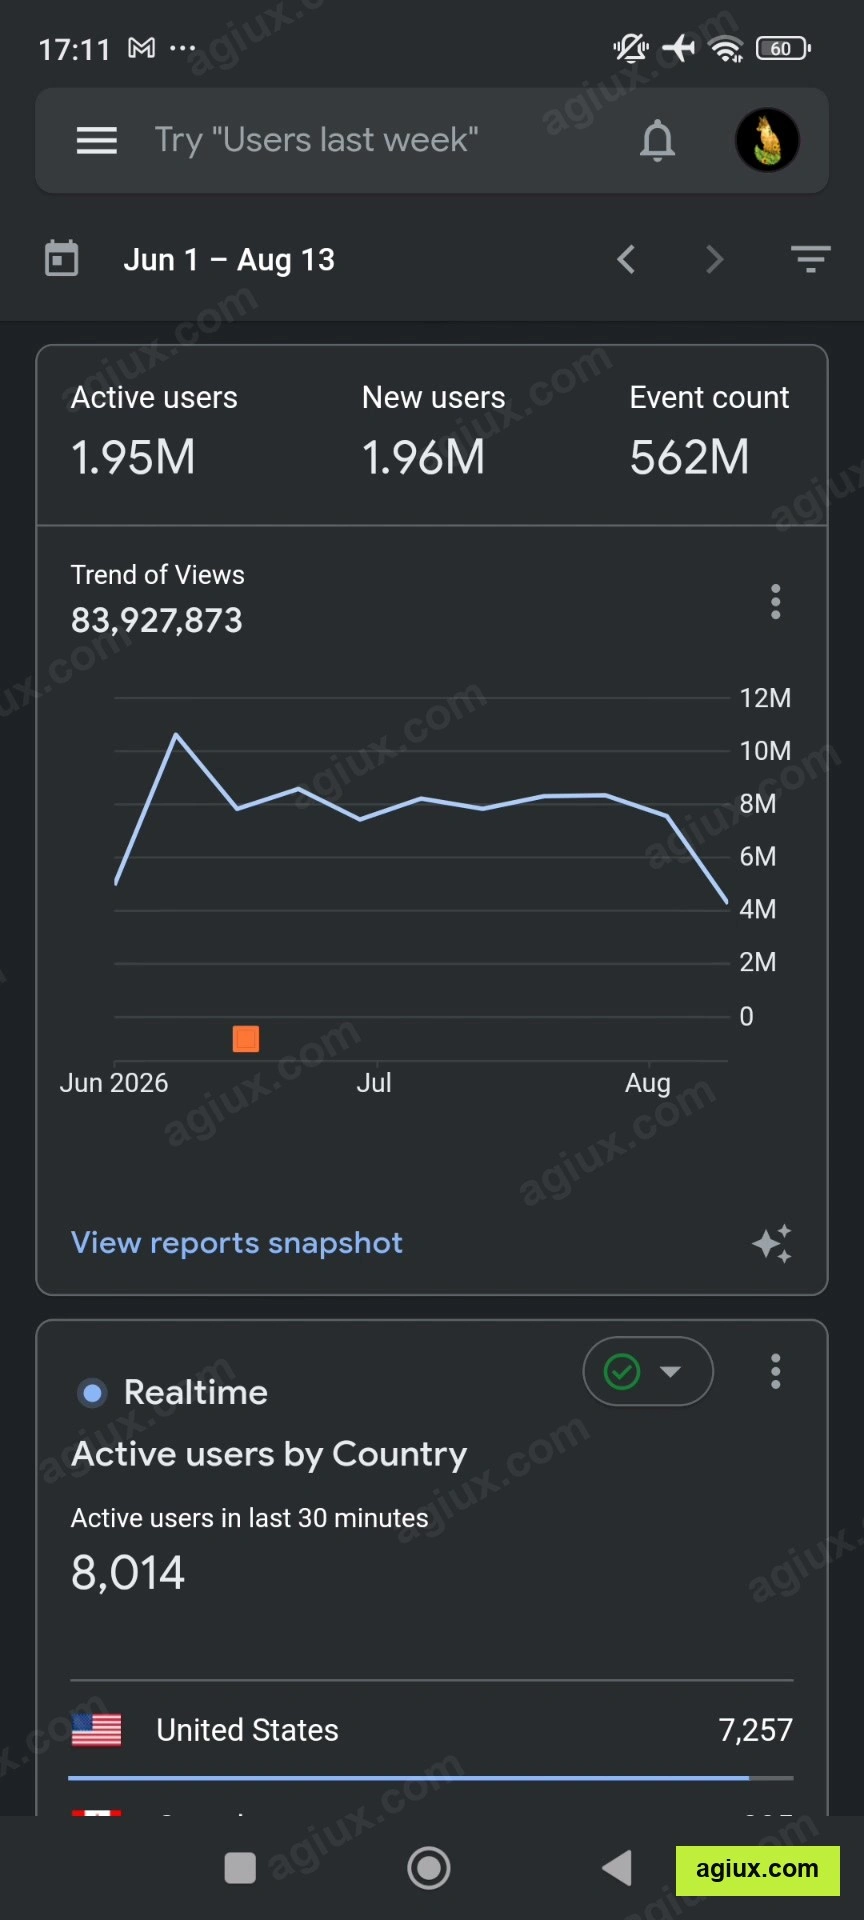
Quarter
What I do on this account
Distribution. The traffic is organic and the acquisition is built rather than bought, which is why the Google organic line is the second largest source and there is no paid channel in the breakdown at all.
On the evidence itself
I recorded the analytics as a screen recording rather than screenshots, because a recording shows the dates changing and the numbers reloading, and a screenshot does not. That video is on my site at agiux.com. Six seconds are cut from it where the screen showed page titles that would have identified the client, and that single edit is disclosed on the page.
Screenshots are watermarked. The originals live at agiux.com.
Like this project
Posted Aug 22, 2026
Ongoing distribution for a client site running 10.1M sessions, 2.8M of them Google organic, with around 8,000 people on it at once. Shared with permission.