Data analysis of customer complaint review

Rohan Sakhrani
What is the project?
In this project, we have a dataset of random people who were distinguished according to their marital status, qualification and their work/business. In work/business they further were distinguished based on their income and finally how many complaints each individual have in particular products. Products include fish, fruit, gold, meat, wines and sweets.
Sheet that shows complaint by customers according to their marital status, education and type of products.
Analysis
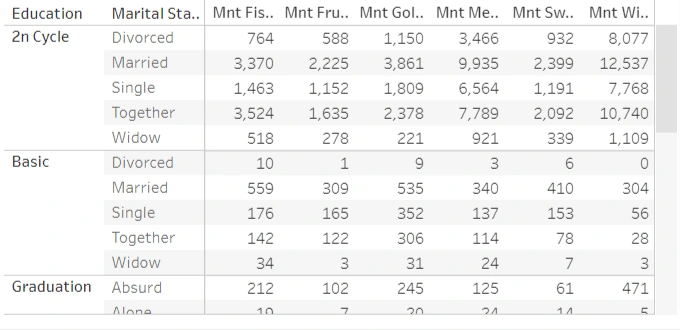
Number of complaints according to products, education and marrital status.
As one can see in the sheet in the 2nd cycle section:
In fish products together and married people are having a maximum number of complaints means partners have a maximum complaint.
In fruits married have more complaints but together has less compared to married and also single have almost same amount of complaints in all products except meat and wine products, so by that we can understand in which products single are more concerned but in meat and wine all people have too much amount of complaints so we can assume that products could be of low or degraded quality.
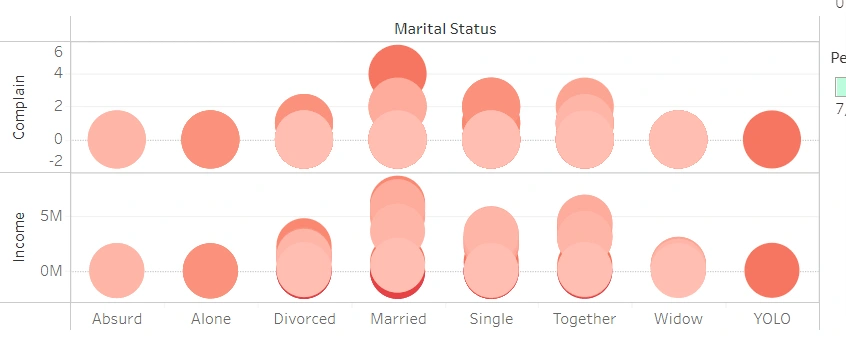
[more darker more web visits]
Analysis:
As you can clearly see married have highest amount of income levels and probabely they are major contributor in sample size.
Alone people have more web visits than absurd but both have almost no complaints regarding products.
In married people as the web visits increses, complaints also increses.
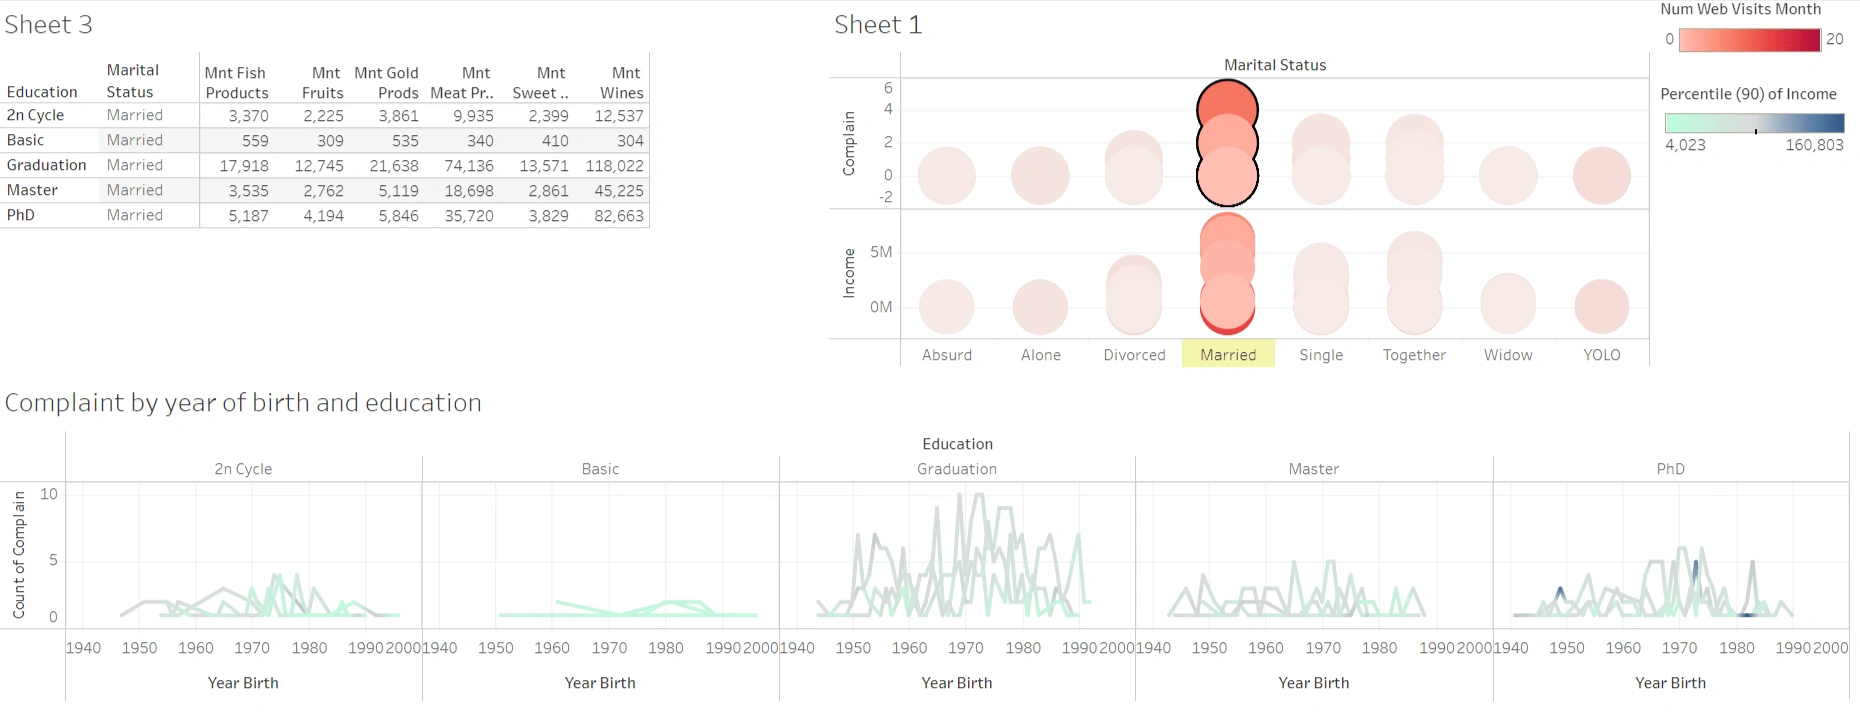
Married people complaint analysis
Analysis:
Educational level- seeing the education people who persued graduation has most amount of complaints followed by phd then masters and 2nd cycle and basic following them but as we can see in PHD people with more income has more complaint but basic and 2nd cycle not contribute much to high income levels as compared to graduation and PHD's.
Birth year- people who are born between 1960 to 1980 have most amount of complaint and as the birth year increses the rate of complaint decreses so we can see a tendency of trust issue in the people who age between 38 to 58 according to 2018 reports.
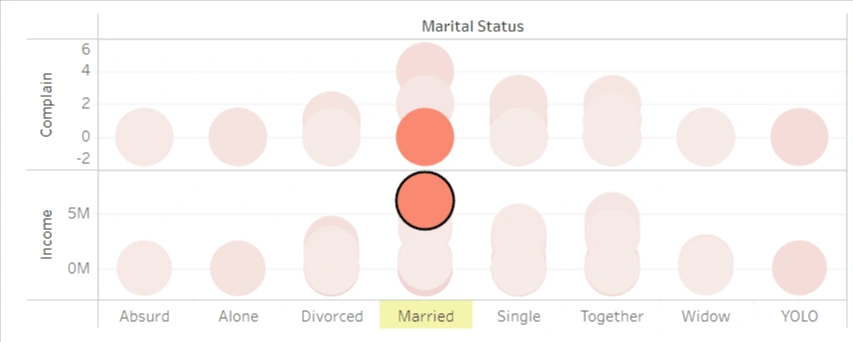
Specific analysis:
People with highest amount of income with married status have lowest amount of complaints and this pattern is seen in almost all groups.
Final analysis:
Married people in any education group has the most amount of complaints followed by together and then singles that means couples have more complaints than single or divorced people
People with more income have least amount of complaints that said we can conclude that income and complaints are inversely proportional to each other.
In married as the web visits increase the complaints increase.
Single complaint pattern : basic < 2nd cycle < Masters < PHD < Graduation.
For detail information and analysis insights:https://public.tableau.com/views/customercomplaintreviewdashboard/Dashboard1?:language=en-US&:display_count=n&:origin=viz_share_link
Like this project
Posted Dec 6, 2021
Likes
0
Views
7