Pulseboard, a React 19 clinic dashboard

View completed workpulseboard-green-chi.vercel.app
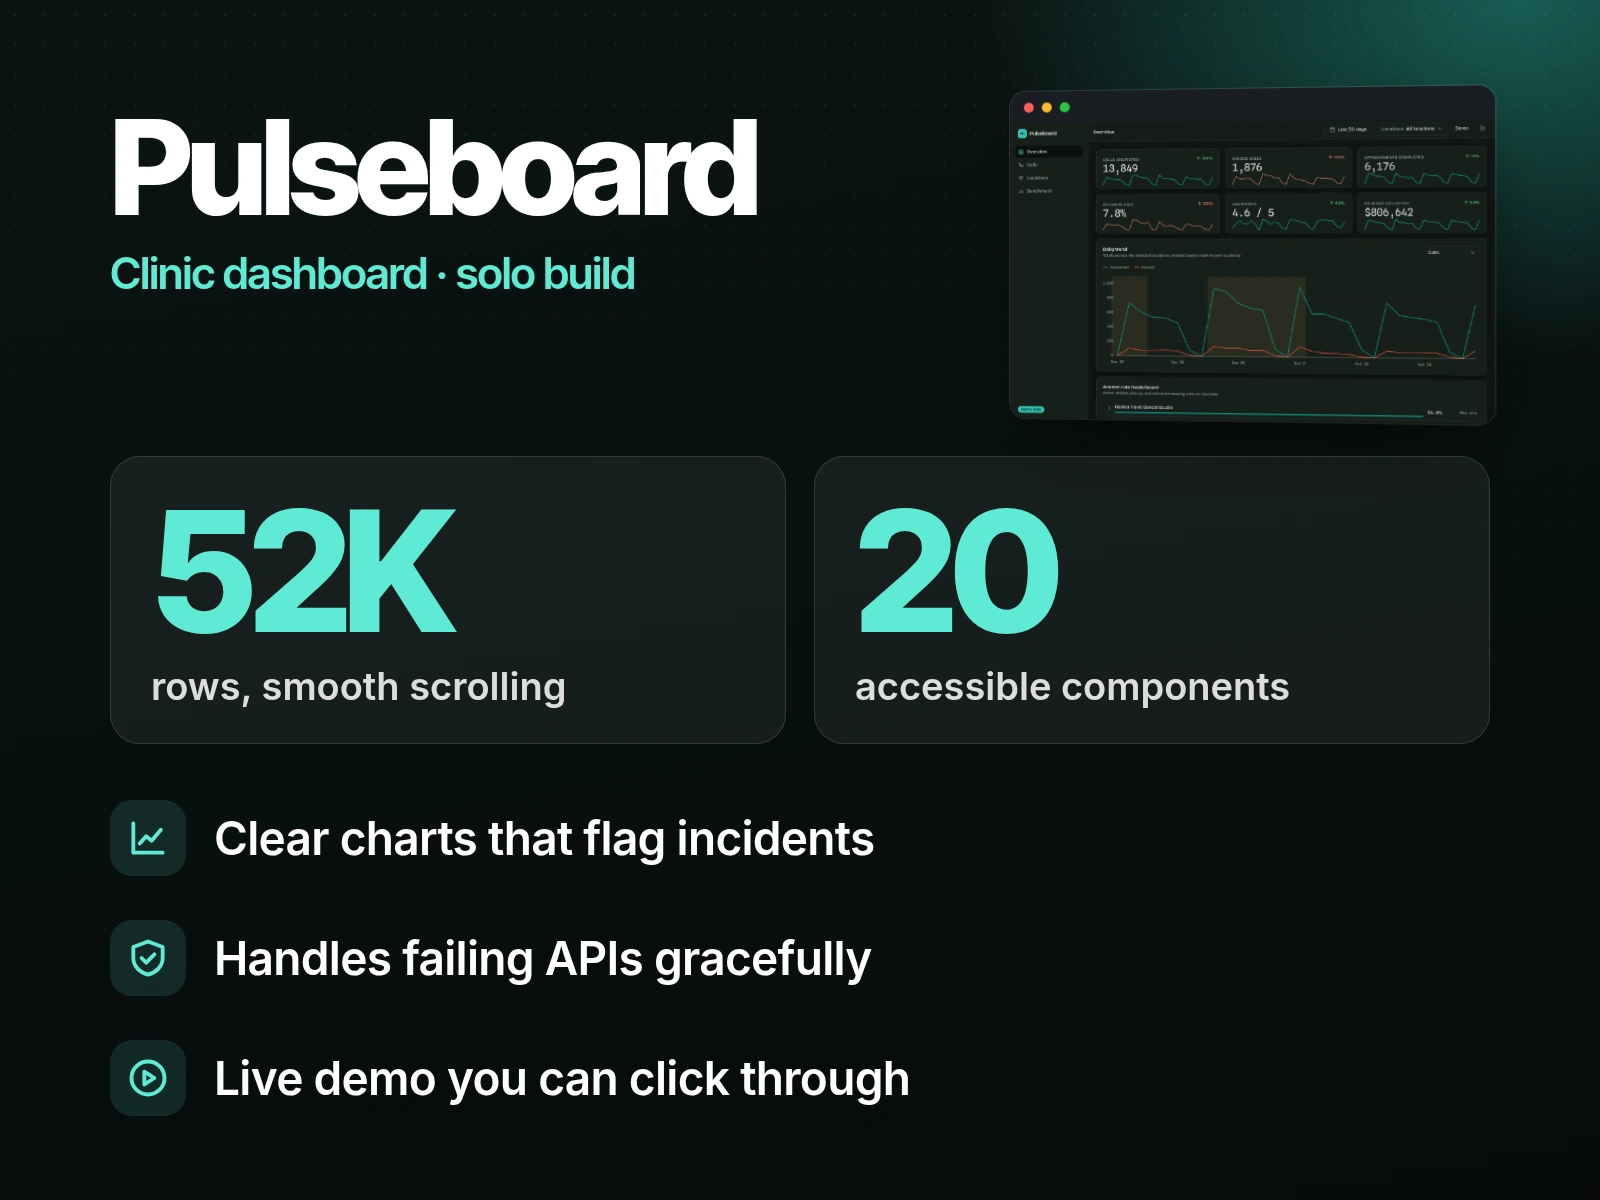
I built this clinic operations dashboard on my own with React 19 and TypeScript.
A virtualized table scrolls smoothly through 52,000 rows.
It has a library of about 20 Storybook components, each checked for accessibility with axe.
The visx trend charts shade the periods with known incidents.
An API failure-mode switch shows how every screen behaves when requests fail.
Live demo: https://pulseboard-green-chi.vercel.app
0 likes · 0 views · Oct 18, 2026
A solo React 19 build: 52K-row virtualized table, 20 accessible Storybook components, visx charts and 260+ tests.