RISEO - Fintech Mobile App

Ian Nyabuto

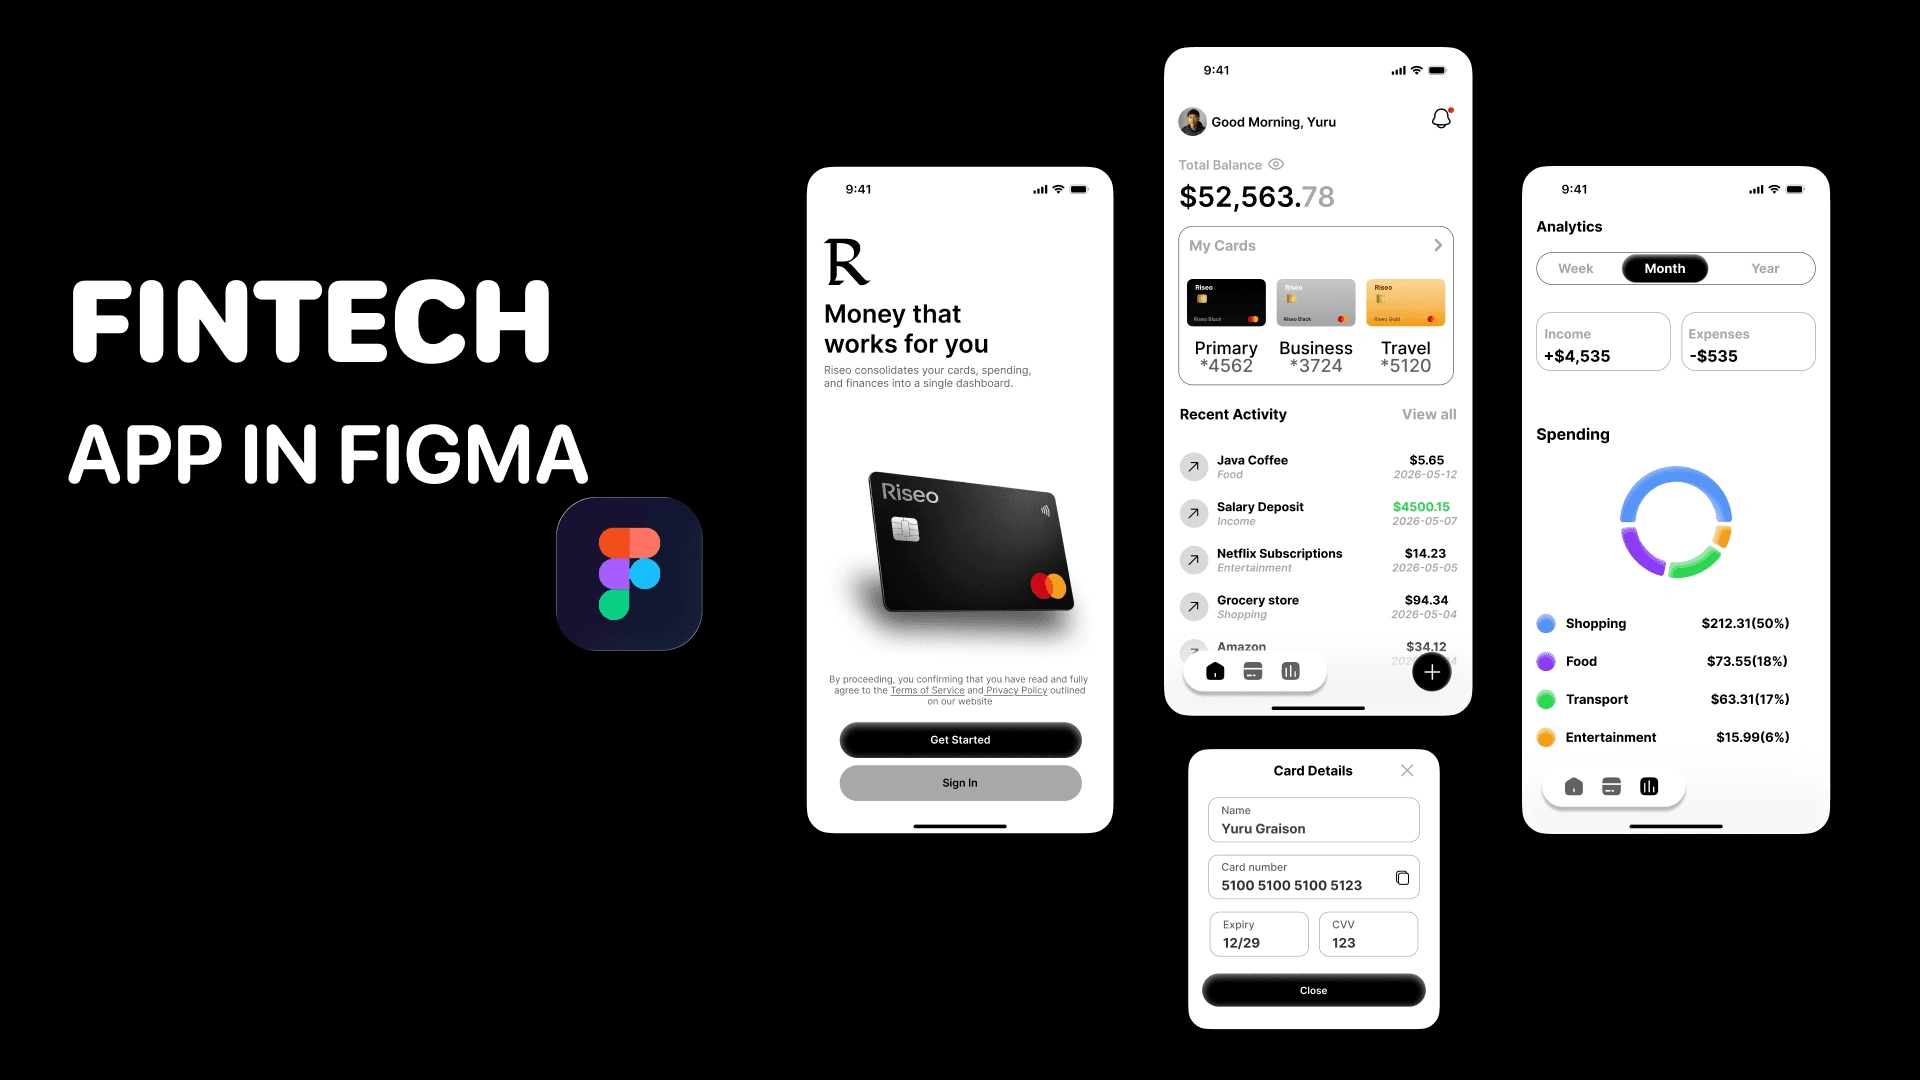
RISEO
Category
Finance
Year
2026
Riseo is a modern fintech mobile application designed to simplify personal finance management through an intuitive and minimal user experience.
The Problem
People know they're overspending. They just don't know where. Most banking apps dump a list of transactions and leave users to figure it out themselves which means they never do.
Riseo's design challenge was simple to say, hard to solve: make a person's financial life legible in under 10 seconds.
Who I Designed For
A young professional juggling multiple cards — a personal account, a business card, a travel card. They check their balance often but rarely understand their spending patterns. They want clarity, not complexity.
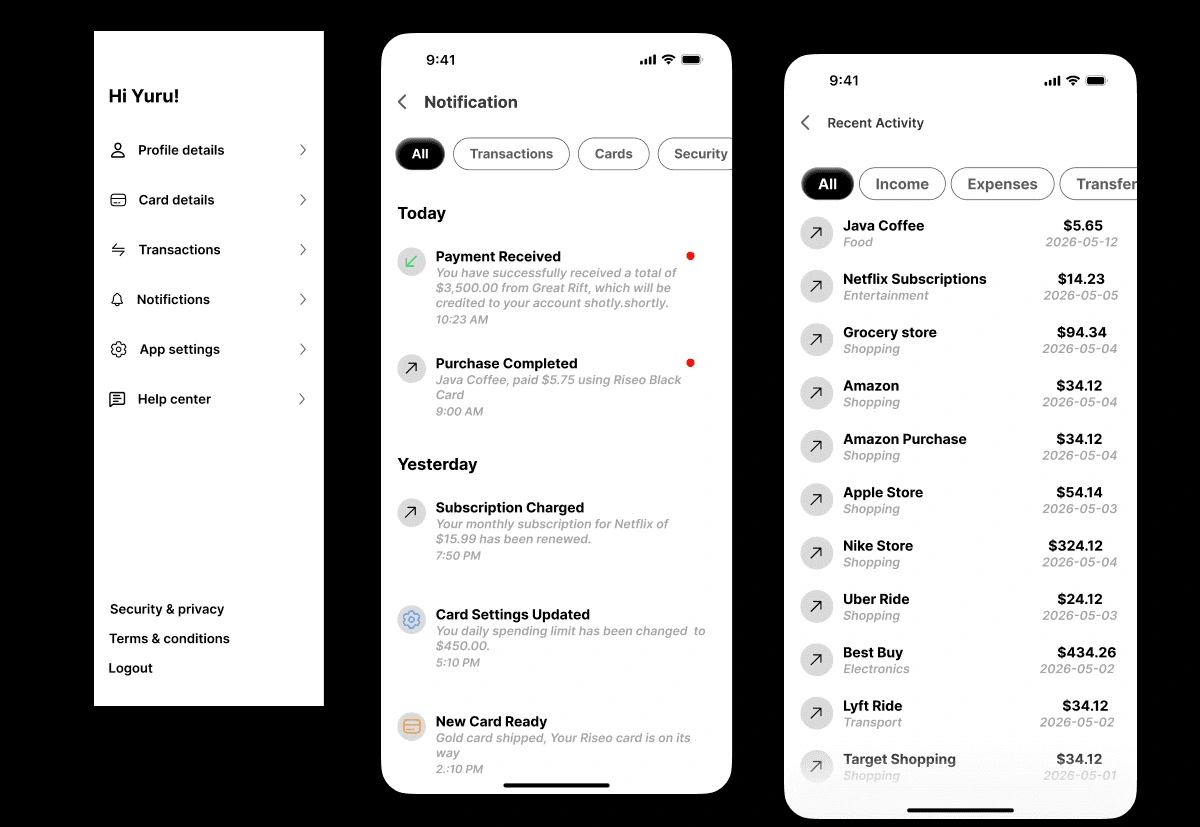
The Design Decisions That Mattered
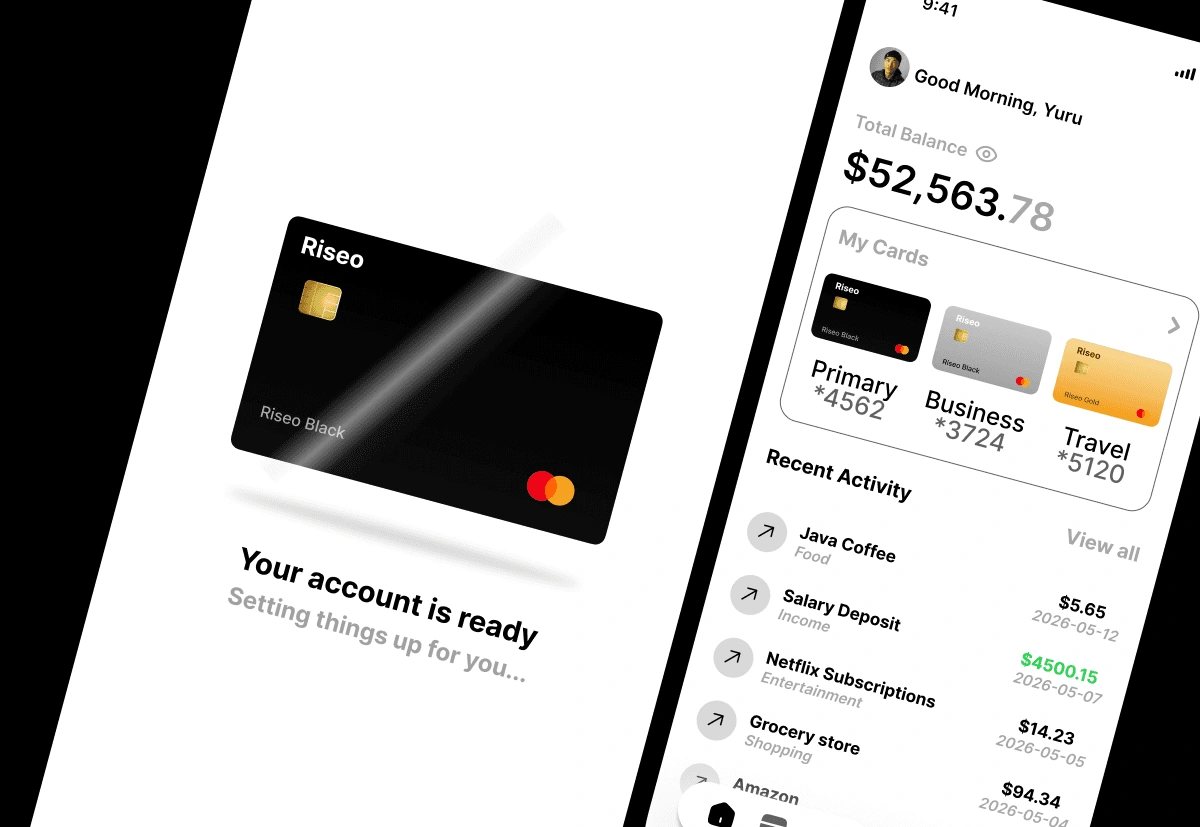
1. Balance first, everything else second. The total balance ($52,563.78) is the largest element on the home screen — bigger than the navigation, bigger than the card carousel. Because that's the one number users open the app to check. Everything else is secondary.
2. Three cards, one glance. Instead of a vertical list of linked accounts, I used a horizontal card carousel with masked numbers and color-coded card types. Users can identify which card they're looking at instantly — no reading required.
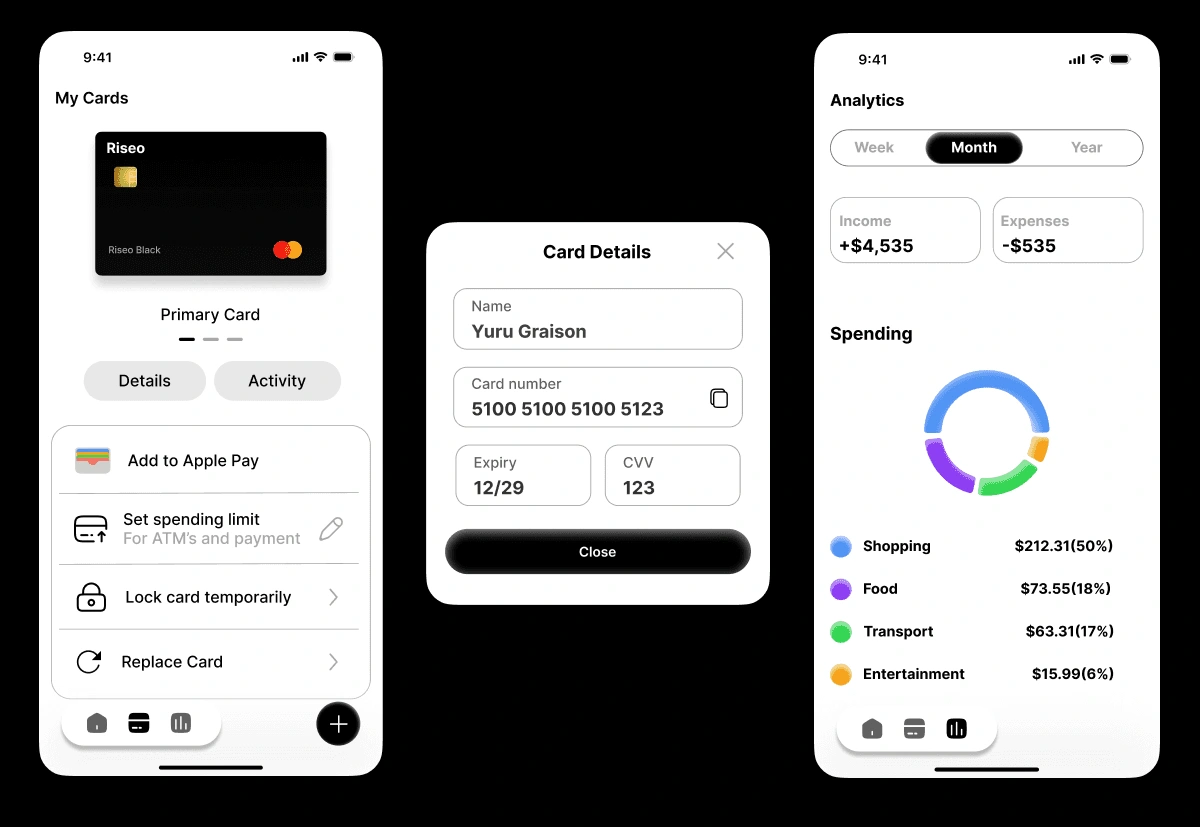
3. The spending donut isn't decoration. Most finance apps bury spending breakdowns in a sub-menu. I put the donut chart on the Analytics screen with four categories: Shopping (50%), Food (18%), Transport (17%), Entertainment (6%). Because the moment a user sees they're spending half their money on shopping, behavior starts to change. Insight has to be unavoidable to be useful.
4. Card Details as a modal, not a new screen. Viewing card info is a sensitive, quick action. Navigating to a new screen adds unnecessary steps and breaks the user's mental context. A modal keeps them anchored to where they were and dismissing it with one tap gets them back instantly.
5. Black and white by design, not by default. The monochrome palette was a deliberate choice to signal trust and seriousness. Finance is high-stakes. Color is used only where it carries meaning — green for income, category colors in the chart. Nothing decorative.
The Outcome
A four-screen Figma prototype onboarding, dashboard, card details, analytics with a consistent, developer-ready design system.
More importantly: a UI where a user can open the app, understand their financial health, and take action all within 10 seconds. That was the brief I set myself. The design delivers it.
Like this project
Posted Jun 11, 2026
Designed a fintech mobile app for personal finance management focused on clarity and quick insights.
Likes
0
Views
4
Tags