Every element of this USA Road Accident Dashboard was develo...
ANNA DUFIE AFRIYIE
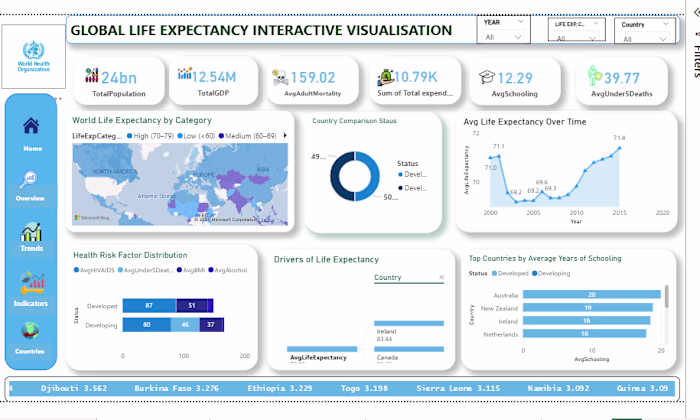
Every element of this USA Road Accident Dashboard was developed to visualize accident patterns and their contributing factors across the country. Using Power BI, the dashboard highlights key insights such as the percentage of night accidents, visibility-related crashes, and geographical hot spots with the highest impact levels. Through interactive visuals and filters, it helps policymakers, transport authorities, and analysts identify risk trends, monitor safety performance, and make data-informed decisions to reduce accident rates nationwide.
Like this project
Posted Oct 16, 2025
Every element of this USA Road Accident Dashboard was developed to visualize accident patterns and their contributing factors across the country. Using Power...
Likes
0
Views
3