Interactive Data Visualization Platform for Geospatial Insights
Nick Howell
Interactive Data Visualization Platform for Geospatial Insights
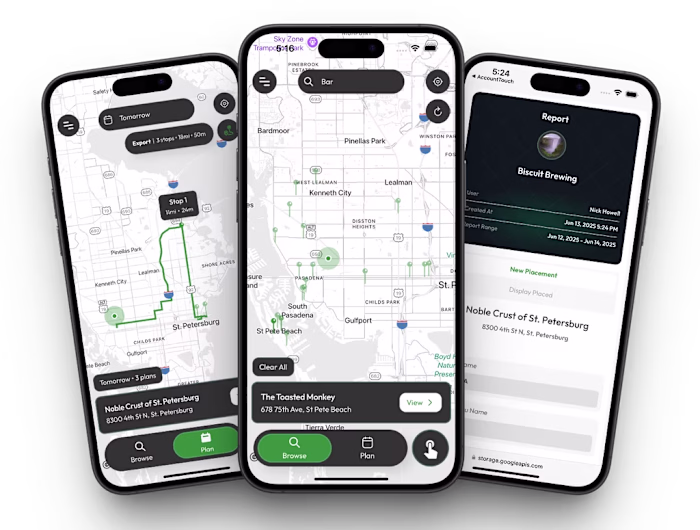
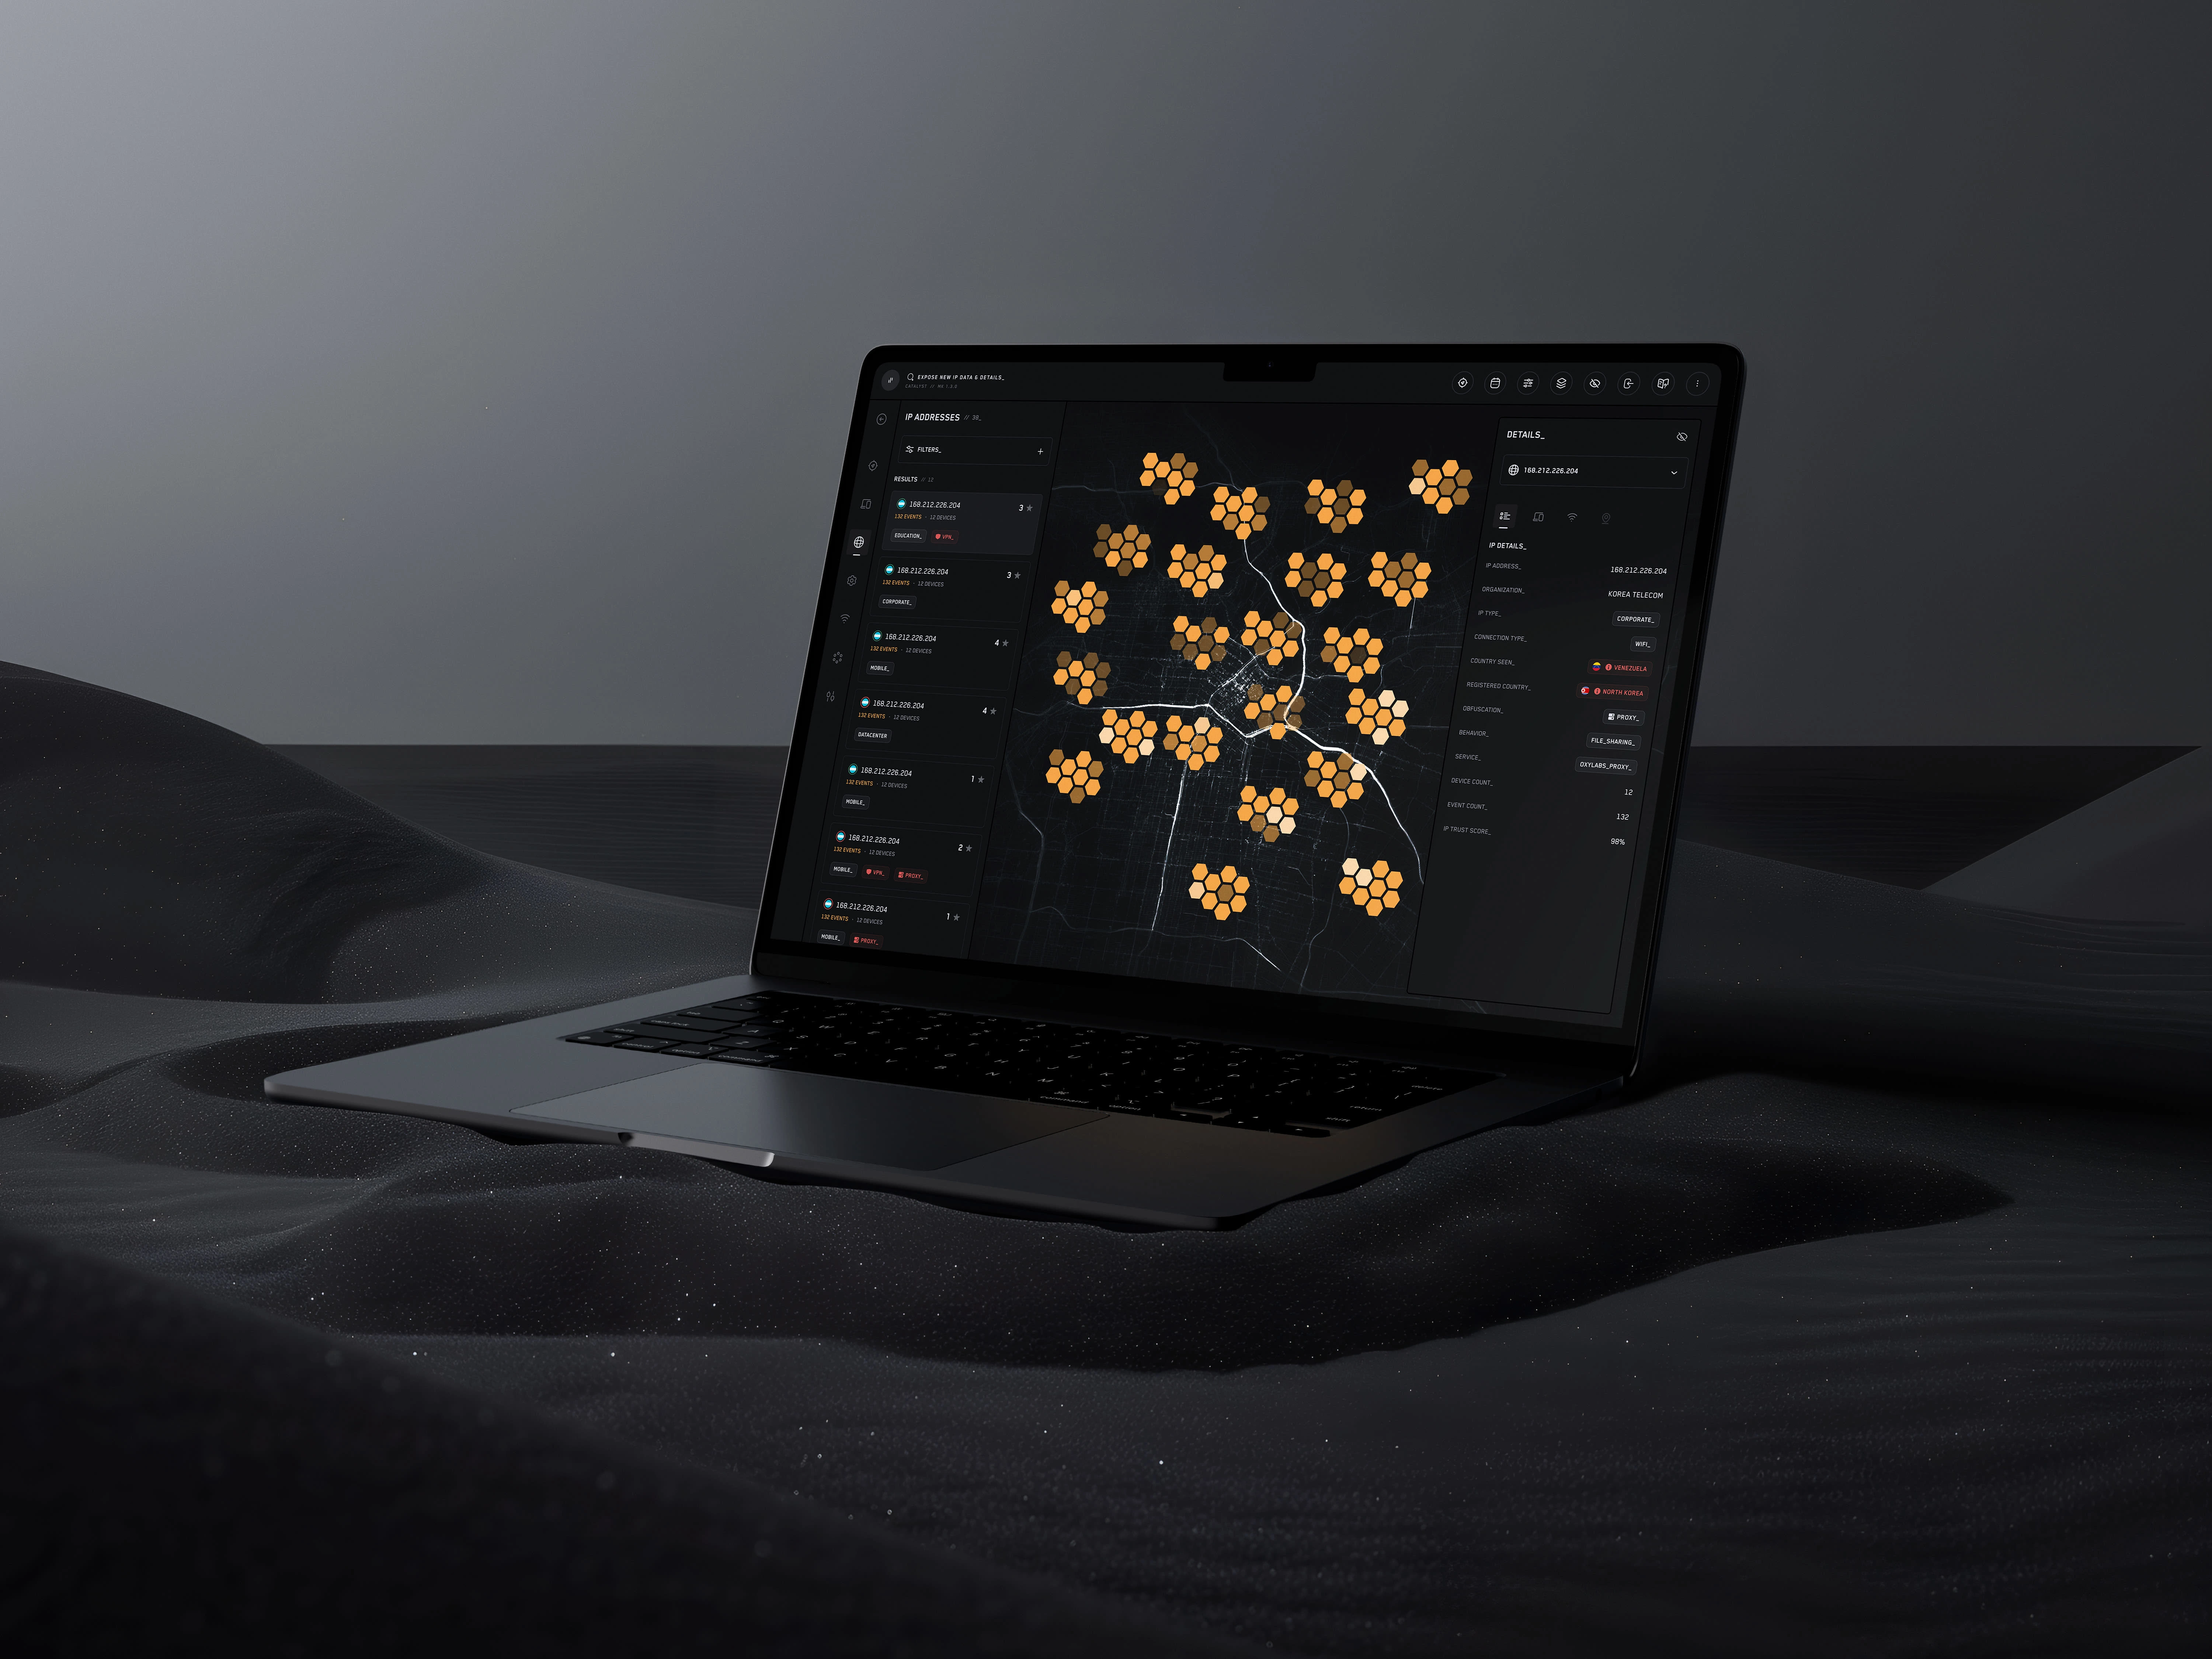
I built a high-performance web application that helps users visualize and understand complex patterns across massive datasets—think petabytes of location and behavior data. The platform turns raw information into clear, interactive visual stories using advanced mapping tools, allowing users to explore and spot meaningful trends.
The frontend is designed in React with smooth, responsive visualizations for even the most data-heavy views. Behind the scenes, I connected everything with a FastAPI service layer and cloud-based infrastructure on Google Cloud to ensure speed, scalability, and reliability.
One of the standout features is the ability to highlight correlations and relationships in data—like where certain behaviors cluster or how they change over time—and then bring them to life with beautiful visual representations.
Whether you're dealing with logistics, mobility, environmental data, or customer behavior at scale, this platform delivers clarity where there was once chaos.
Like this project
Posted Jul 21, 2025
Built a web app for visualizing complex geospatial data patterns using React and FastAPI.
Likes
2
Views
14