
Om Gugari
Python | SQL | Power BI | Aspiring Data Analyst
New to Contra
Om is building their profile!
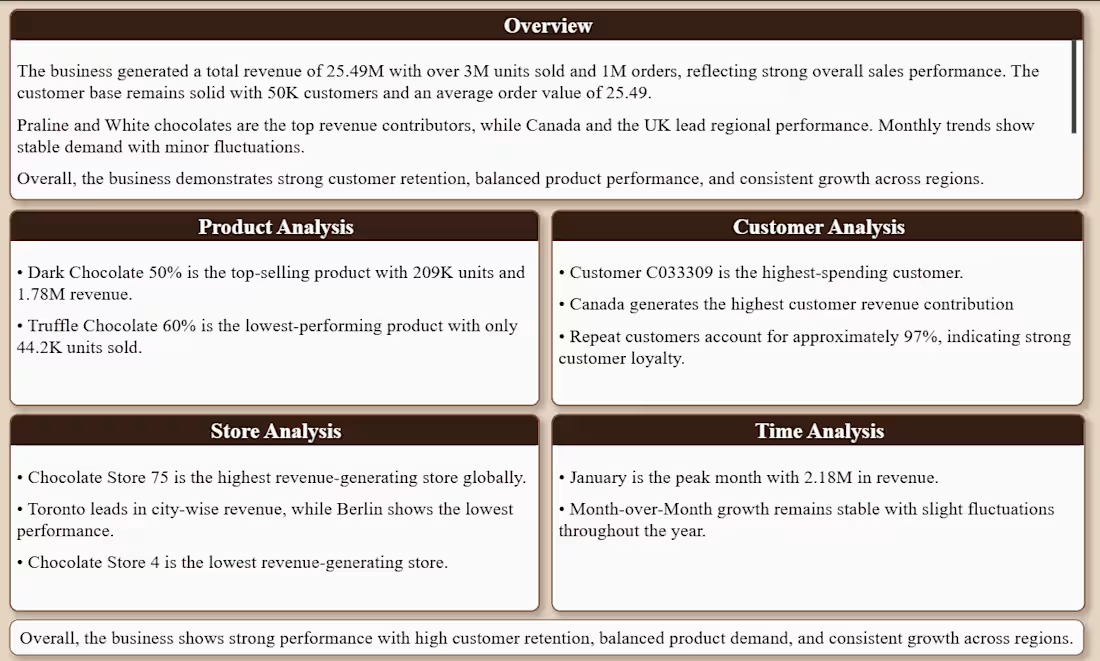
This project presents a comprehensive Chocolate Sales Analysis Dashboard built using Power BI. It provides insights into sales performance, customer behavior, product trends, and regional/store-level analysis.
The dashboard is designed with a premium chocolate-themed UI to deliver both business insights and strong visual storytelling.
🎯 Key Objectives
Analyze overall sales performance
Identify top-performing products and categories
Understand customer behavior (new vs repeat customers)
Evaluate store and regional performance
Track monthly and growth trends (MOM %)
📁 Dataset
The analysis is based on the following tables:
Sales
Customers
Products
Stores
Calendar
📌 Dashboard Pages
1️⃣ Overview
Total Revenue: 25.49M
Total Units Sold: 3M
Total Orders: 1M
Total Customers: 50K
Avg Order Value: 25.49
✔ Highlights:
Praline & White chocolate lead revenue
Canada & UK are top-performing regions
Stable monthly sales trend
2️⃣ Product Analysis
Top Product: Dark Chocolate 50%
Lowest Product: Truffle Chocolate 60%
Category contribution analysis
Top & Bottom product performance
3️⃣ Customer Analysis
High repeat customer rate (~97%)
Top customer identified
Customer spending distribution
City-wise and country-wise insights
4️⃣ Store Analysis
Top Store: Chocolate Store 75
Lowest Store: Chocolate Store 4
City-level revenue insights
Store performance comparison
5️⃣ Time Analysis
Peak Month: January
MOM growth shows slight fluctuations
Monthly & quarterly trend analysis
🧠 Key Insights
Strong customer retention indicates brand loyalty
Balanced product contribution across categories
Stable demand across months
Consistent performance across regions
🛠️ Tools & Skills Used
Power BI
DAX (CALCULATE, FILTER, DATEADD, VAR, DIVIDE)
Data Modeling
Data Visualization
KPI Design
Dashboard UI/UX Design
🎨 Design Highlights
Chocolate-themed professional color palette
Clean layout with KPI cards & insights section
Consistent icon usage
Business-friendly storytelling
0
3
Overview
This project analyzes bookstore sales data using SQL. It focuses on extracting meaningful business insights from transactional data by working with relational tables.
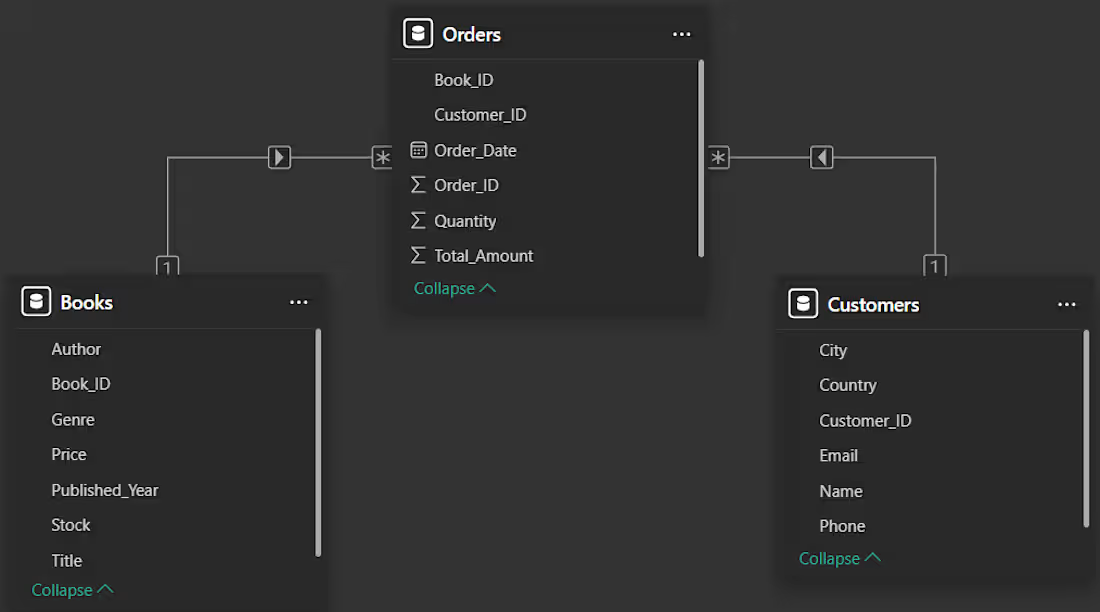
🧱 Database Schema
The project is built using three main tables:
🔹 Books
Stores details about books such as title, author, genre, price, and stock.
🔹 Customers
Contains customer information including name, city, and country.
🔹 Orders
Transaction table that records book purchases, including quantity and total amount.
0
7