
Nusrat Rukaiya
Data Analyst | Power BI Dashboards & Excel Reporting
Profile in progress
Nusrat is building their profile!
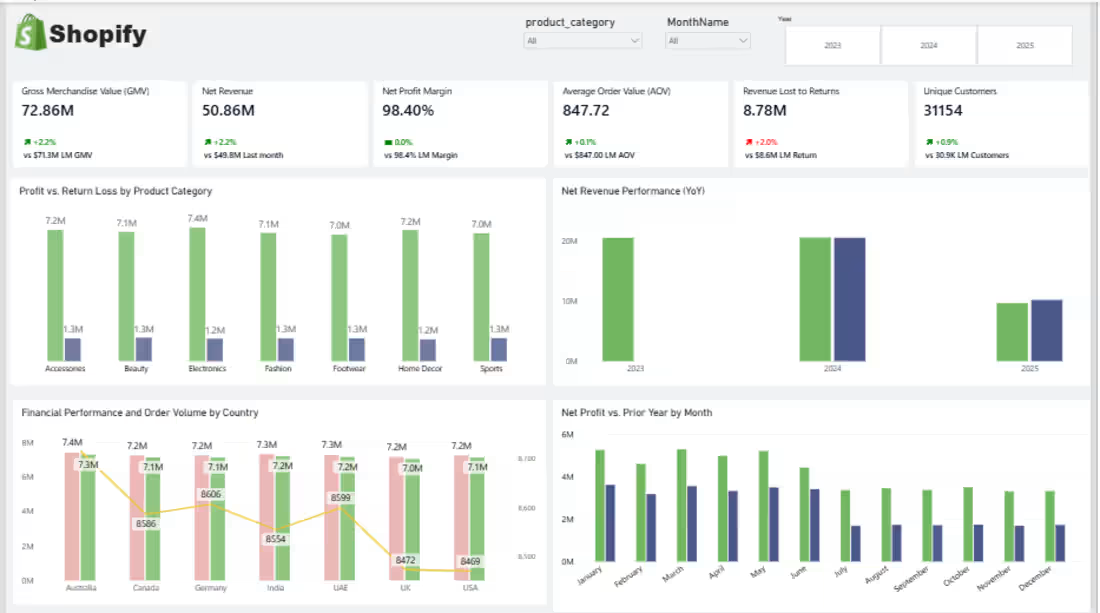
From 2023 to 2025, revenue grew to $50.86M, up 2.2%. GMV hit $72.86M, showing the platform is bringing in and converting customers well. Growth wasn't steady though.
2024 was almost flat compared to 2023, then picked up again in 2025. Australia has the most orders out of the six countries tracked. One odd thing: profit and return losses look almost the same across every product category and every country, which shouldn't normally happen ,it's worth flagging😀 not explaining away. March had the strongest month, with about $5.28M in profit.
All the information indicates the retail business is running well, with a strong GMV showing that people are becoming aware of the platform and coming to purchase.
0
17
Project Title:
Book Sales Dashboard — Power BI & SQL
Short description:
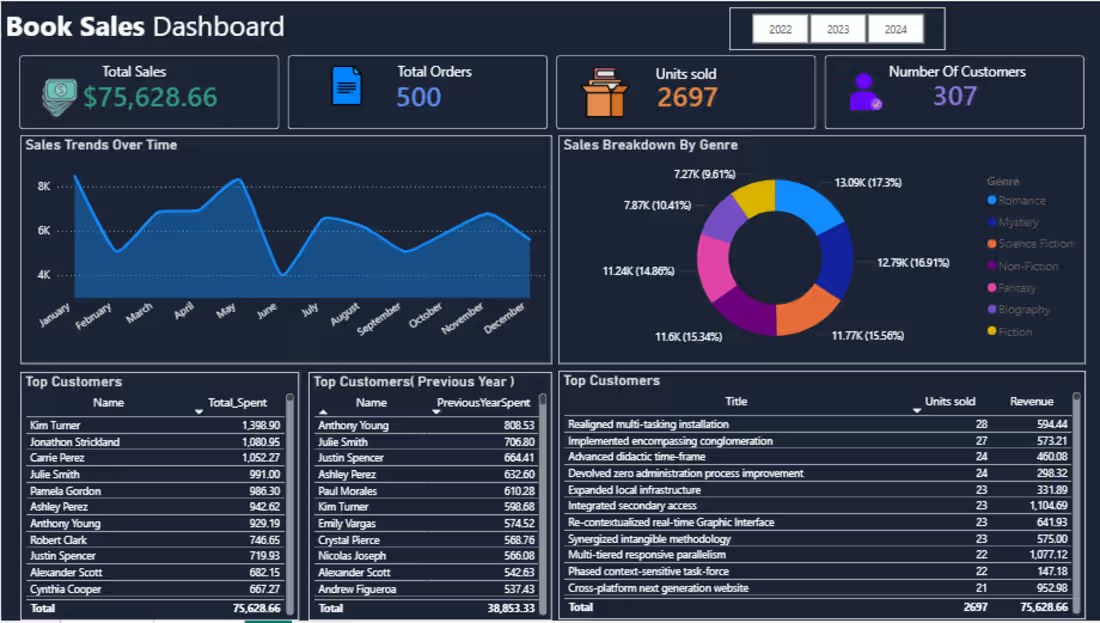
Transformed 3 years of raw book sales data into a clean, interactive Power BI dashboard — validated with SQL for 100% accuracy.
What I built:
•KPI cards tracking $75K+ in sales, 500 orders, 2,697 units, 307 customers
•Monthly sales trend to spot peaks and patterns
•Genre revenue breakdown by donut chart
•Top customer performance — year over year comparison
How I worked:
SQL first to clean and verify → Power BI to visualize → DAX for dynamic measures
Tools: SQL · Power BI · DAX · Excel · Data Visualization
0
33
HR Analytics Dashboard | Power BI
Tools: Power BI, Excel
Overview:
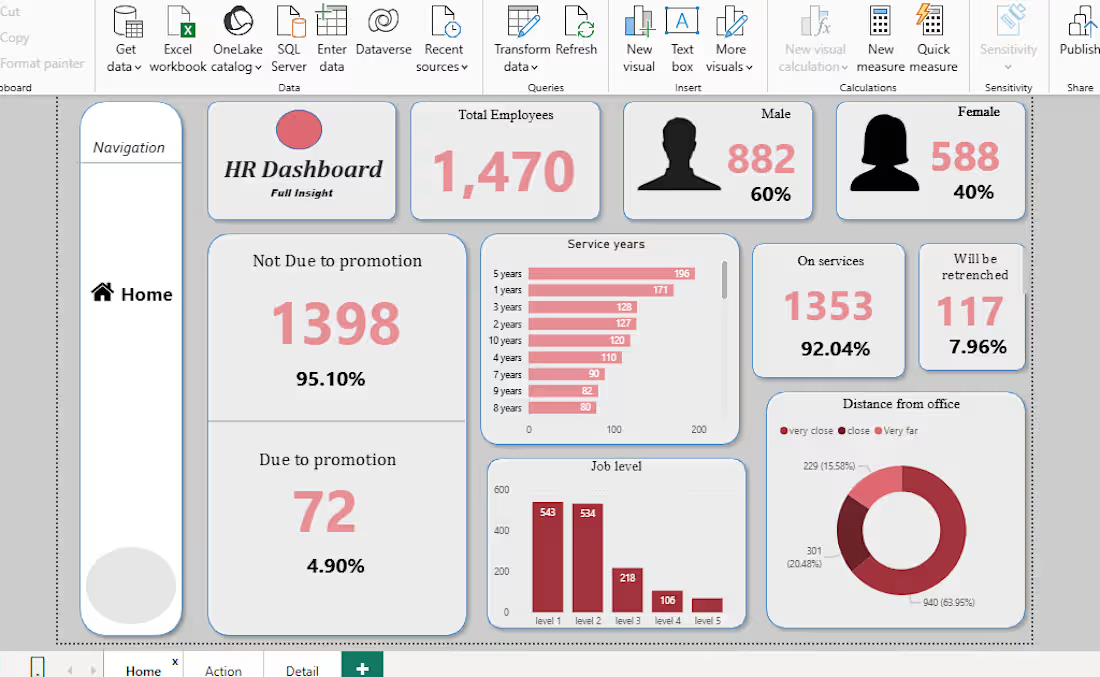
Designed an interactive HR analytics dashboard to analyze employee distribution, gender ratio, promotions, attrition, and service years.
Key Insights:
• Total employees and gender breakdown
• Promotion vs non-promotion analysis
• Attrition trends
• Service years distribution
Outcome:
This dashboard helps HR teams make data-driven decisions related to workforce planning and retention.
0
36
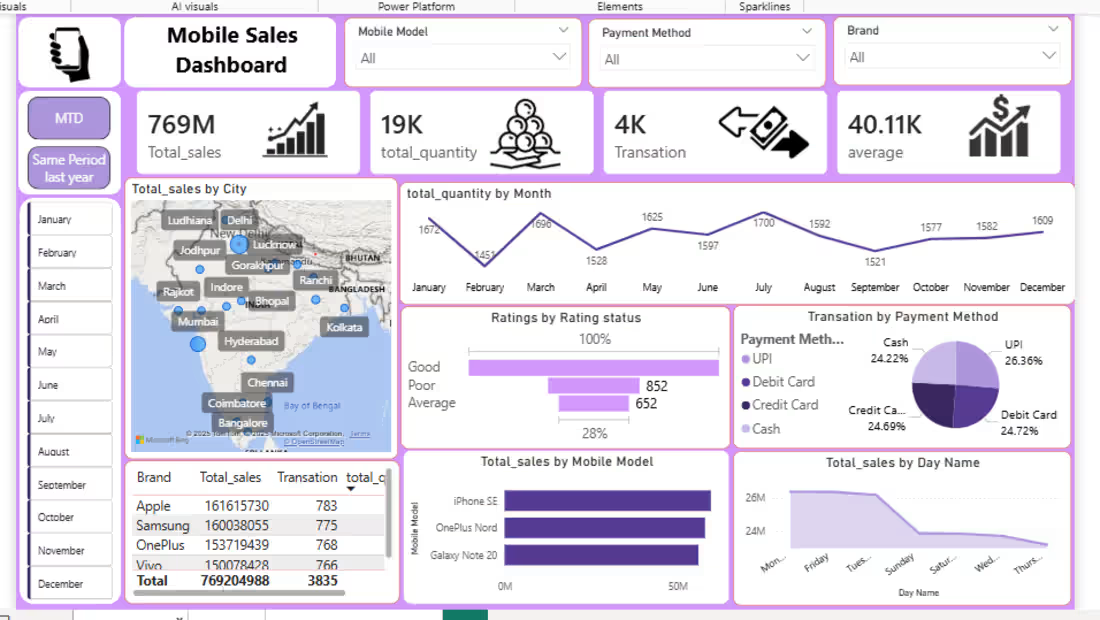
Mobile Sales Analytics Dashboard | Power BI
Tools: Power BI, Excel
Overview:
Built an interactive mobile sales analytics dashboard to track sales performance across brands, cities, payment methods, and time periods.
Key Insights:
• Total sales, quantity sold, and transaction volume
• Sales trends by month and day
• City-wise and brand-wise performance
• Payment method distribution (UPI, Card, Cash)
• Customer rating analysis
What I Did:
• Cleaned and structured raw sales data in Excel
• Created KPIs and DAX measures
• Designed interactive visuals and filters
• Built a decision-ready dashboard for business users
Outcome:
Enables businesses to identify top-performing brands, cities, and payment channels to improve sales strategy.
0
41