
pro
Megan Ayala
Veteran software developer delivering reliable solutions.
New to Contra
Megan is building their profile!

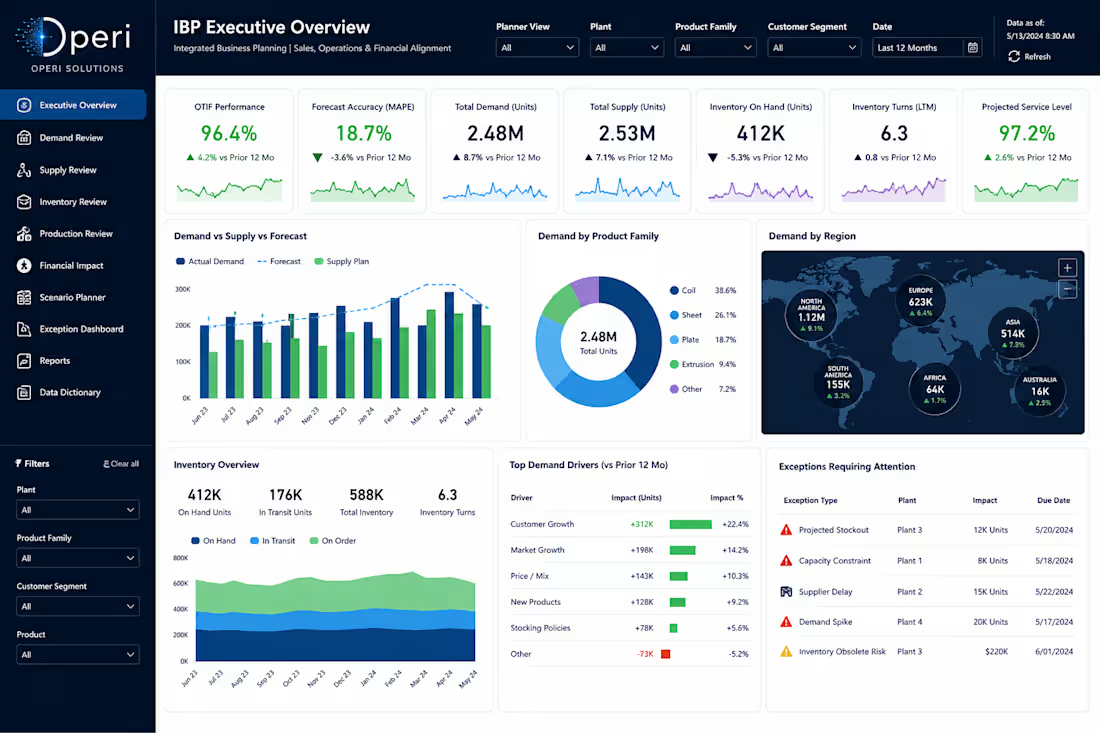
Integrated Business Planning Executive Dashboard
This concept presents a centralized IBP workspace that aligns demand, supply, inventory, production, and financial performance in one executive view. Leaders can monitor forecast accuracy, OTIF performance, service levels, inventory turns, regional demand, and supply constraints without switching between disconnected reports.
The dashboard is designed to support monthly planning reviews by highlighting performance trends, key demand drivers, operational exceptions, and risks requiring action. It gives decision-makers a clearer view of how commercial demand, production capacity, inventory, and financial outcomes affect one another.
0
18
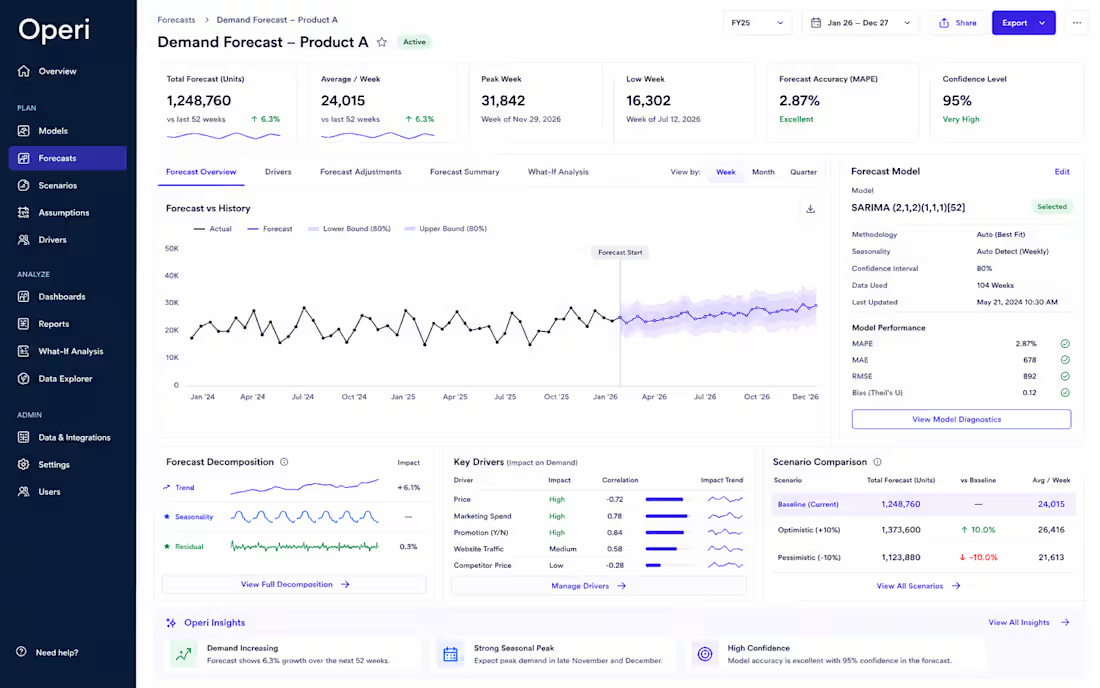
Demand Forecasting & Demand Planning
This concept demonstrates a modern demand planning workspace that combines statistical forecasting with interactive business intelligence. Users can compare historical demand against forecasted values, visualize confidence intervals, analyze key demand drivers, evaluate forecast accuracy, and model multiple planning scenarios—all from a single interface.
Designed for supply chain, operations, and finance teams, the dashboard helps transform historical data into actionable forecasts that support inventory planning, production scheduling, and strategic decision-making.
0
24
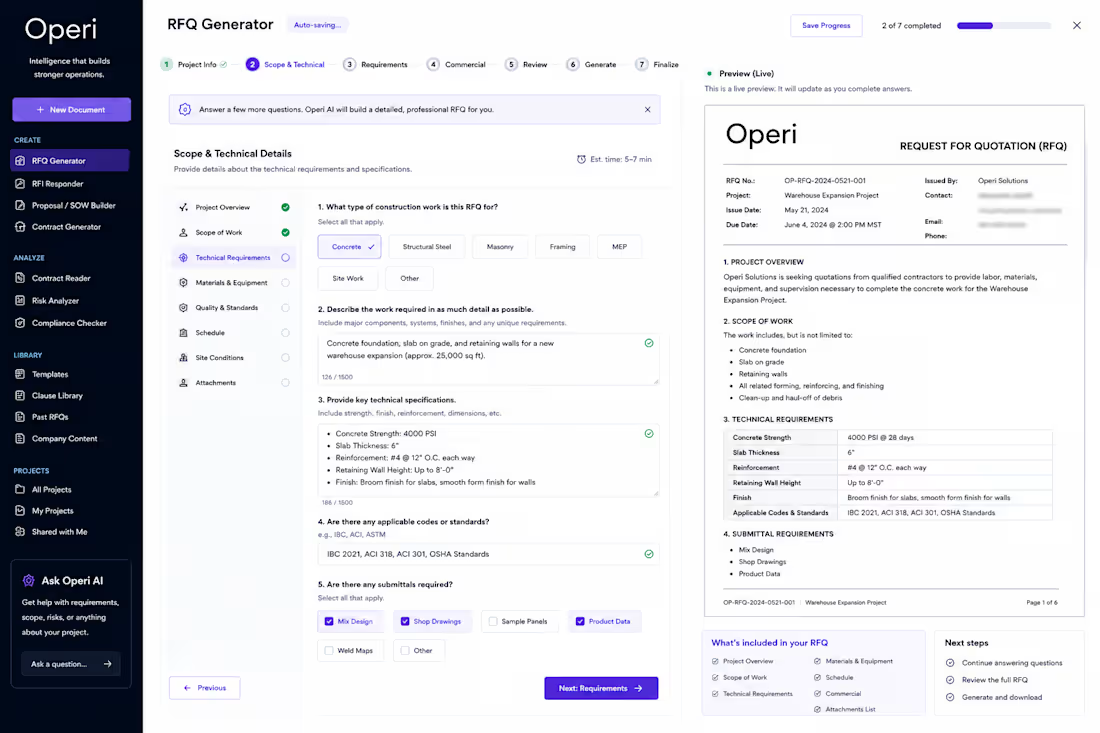
AI-Powered RFQ Generator
This concept streamlines one of the most time-consuming parts of project procurement by guiding users through a structured workflow that automatically generates a professional, well-formatted Request for Quotation (RFQ).
Instead of starting from a blank document, users answer guided questions about scope, technical requirements, materials, standards, schedules, and commercial terms while a live preview builds the RFQ in real time. The goal is to reduce manual effort, improve consistency, and help teams create higher-quality procurement documents faster.
0
14
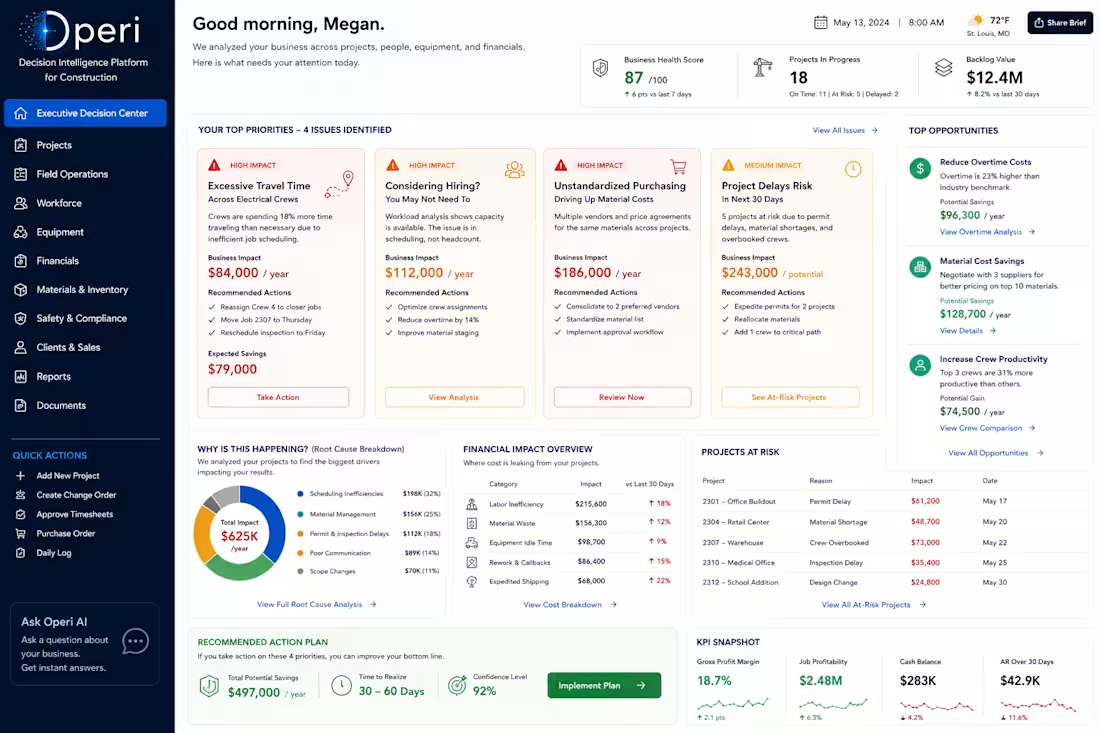
Executive Decision Center – Construction Analytics
This concept showcases how operational data can be transformed into actionable business decisions. Instead of simply reporting KPIs, the platform identifies root causes, quantifies financial impact, prioritizes the highest-value opportunities, and recommends specific actions to improve profitability.
Designed for construction and project-based organizations, this dashboard connects project management, workforce, financial, purchasing, and field operations into a single executive view—helping leaders spend less time searching for information and more time making decisions.
0
11
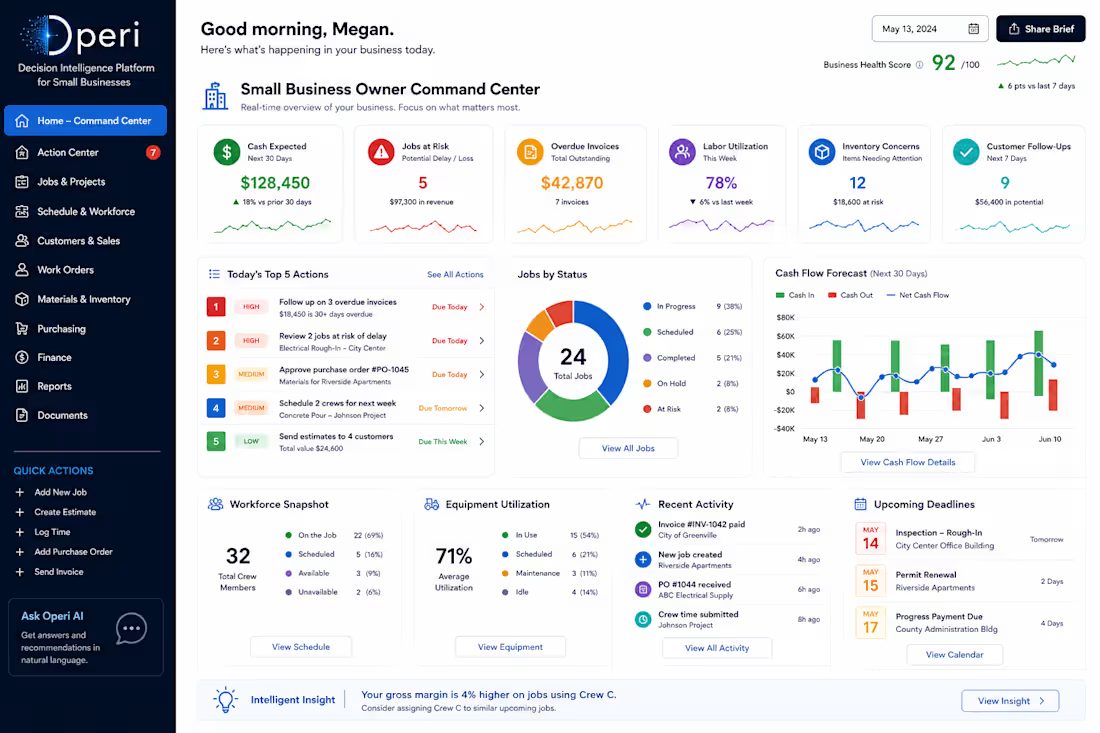
Here’s a concept I’ve been working on for a modern small-medium sized business command center.
The goal isn’t to create another dashboard—it’s to give business owners a single place to understand what’s happening across their entire operation. Financials, projects, customers, workforce, inventory, and upcoming priorities all connected in one view.
This is the type of business systems architecture and decision intelligence I enjoy building: solutions that connect existing software, eliminate information silos, and help organizations make better decisions faster. If you’re looking to modernize how your business operates, I’d love to connect.
1
48