
Maria Garsel
Financial Systems, Dashboards & Reporting Clarity
New to Contra
Maria is ready for their next project!
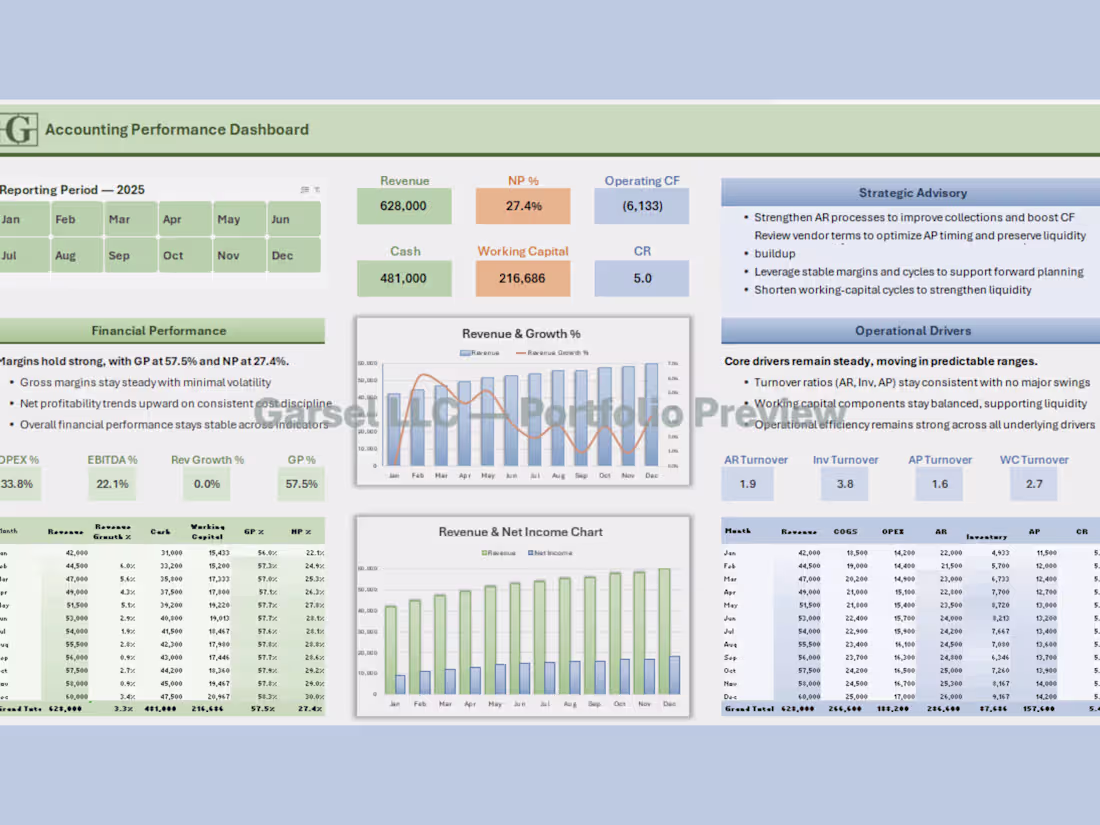
Accounting Performance Dashboard
An executive-level accounting dashboard consolidating revenue, margins, cash flow, working capital, and operational drivers into a clean, decision‑ready snapshot.
Includes:
• Monthly revenue, margin, and cash-flow performance
• Working-capital structure and liquidity indicators
• Operational drivers (AR, AP, inventory, turnover ratios)
• Trend analysis across revenue, GP%, NP%, and OPEX%
• Strategic advisory insights for financial improvement
1
41
Financial Model - Investor Snapshot
An investor-ready snapshot for “TaskPilot” (placeholder name used to protect client data), combining product positioning, market opportunity, revenue model, and financial trajectory into a clean, pitch‑deck‑grade overview.
Includes:
• Market positioning and product value narrative
• Revenue model and pricing structure
• Customer acquisition and growth assumptions
• Multi‑year financial trajectory and key metrics
• Clean, investor‑grade visual presentation
1
51
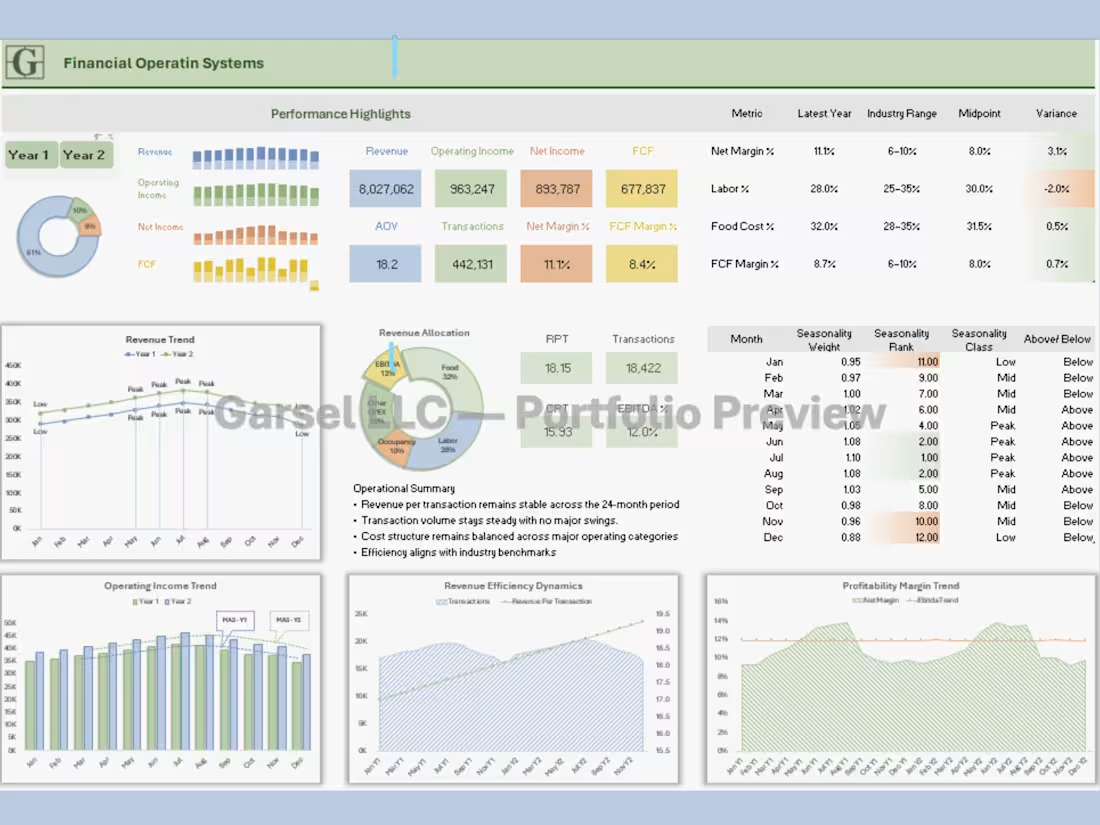
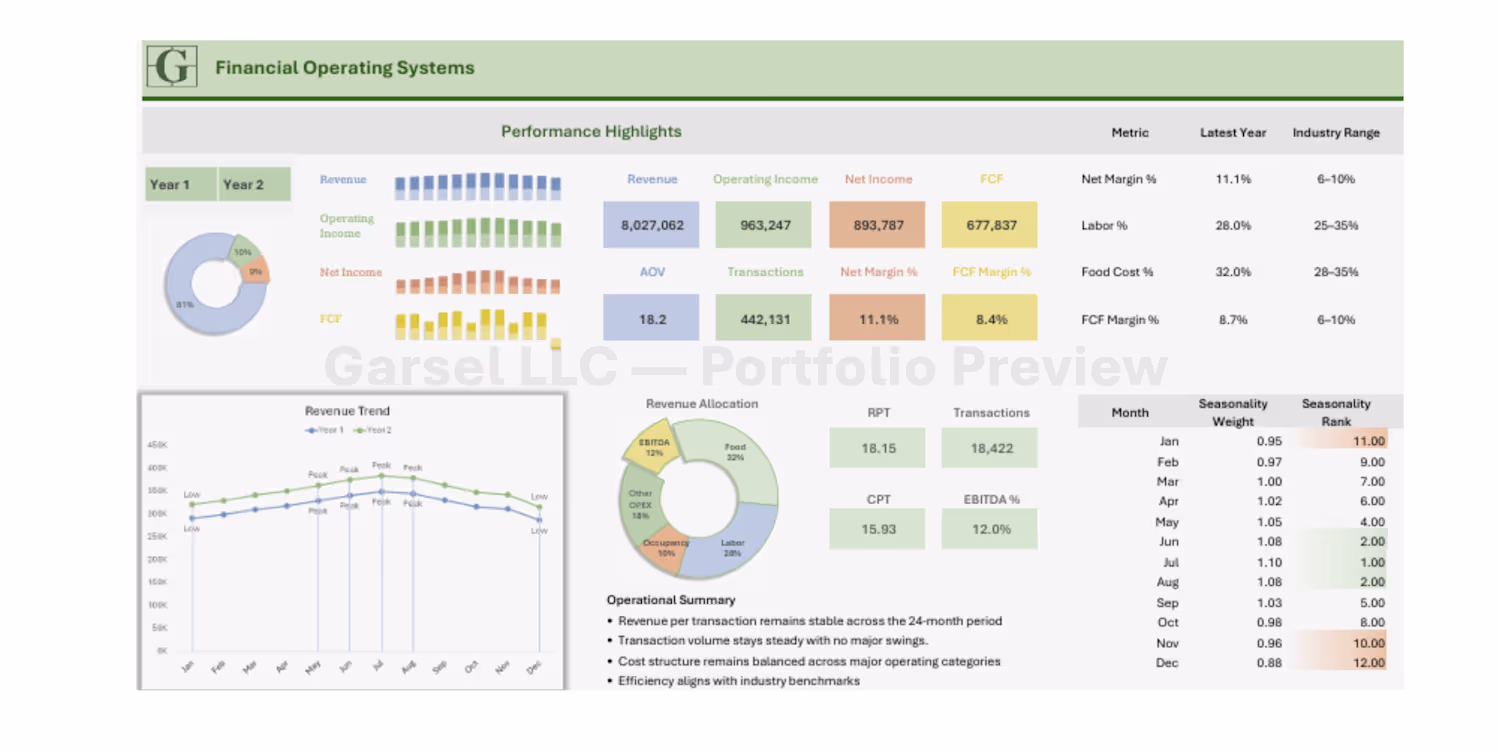
Financial Operating System (FOS)
A multi‑year Financial Operating System combining revenue, cost structure, efficiency metrics, and margin trends into a unified reporting framework.
Includes:
• Multi-year revenue, COGS, and margin performance
• Operating expense structure and efficiency ratios
• Trend analysis across growth, profitability, and cost drivers
• Consolidated reporting architecture for strategic decision‑making
• Clean, scalable system for ongoing financial visibility
0
49
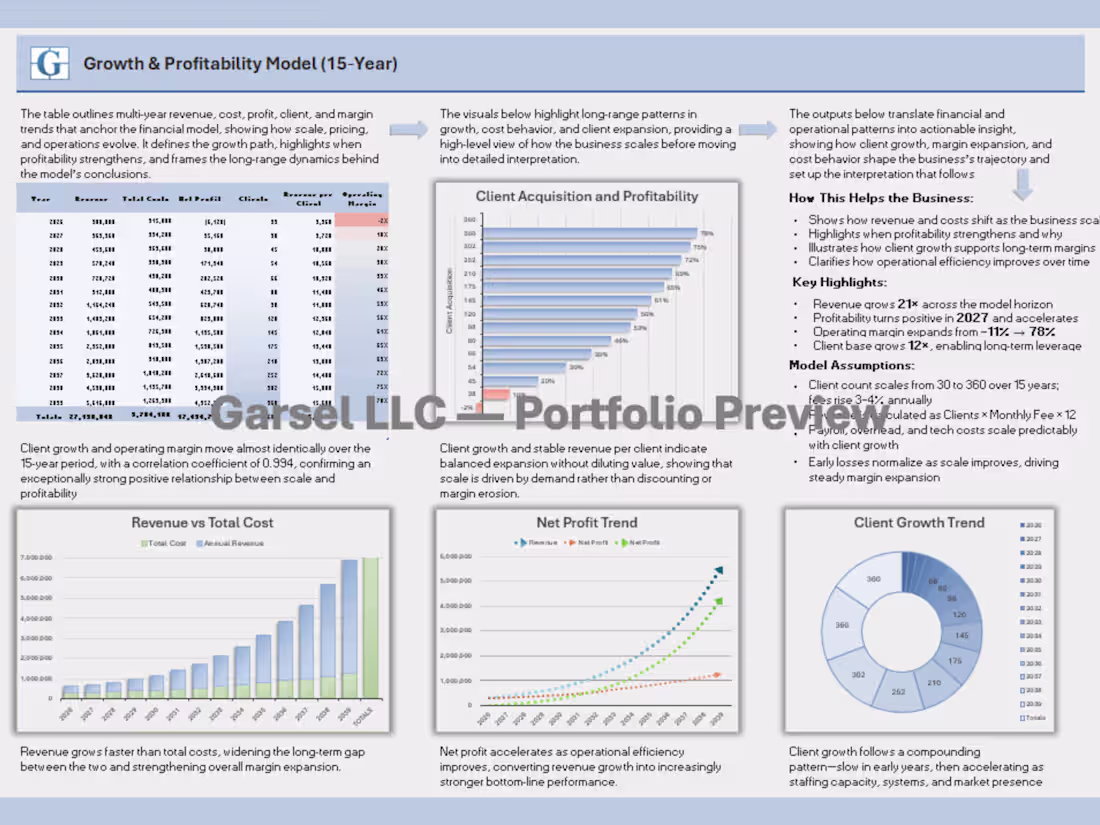
Growth & Profitability Model - 15-Year Forecast
A long-range, driver-based forecasting model projecting revenue, margins, customer growth, and profitability over a 15-year horizon.
Includes:
• Compounding client growth and retention dynamics
• Revenue, COGS, and margin expansion modeling
• Operating expense structure and efficiency trends
• Long-range cash flow and profitability projections
• Scenario-based forecasting for strategic planning
0
56
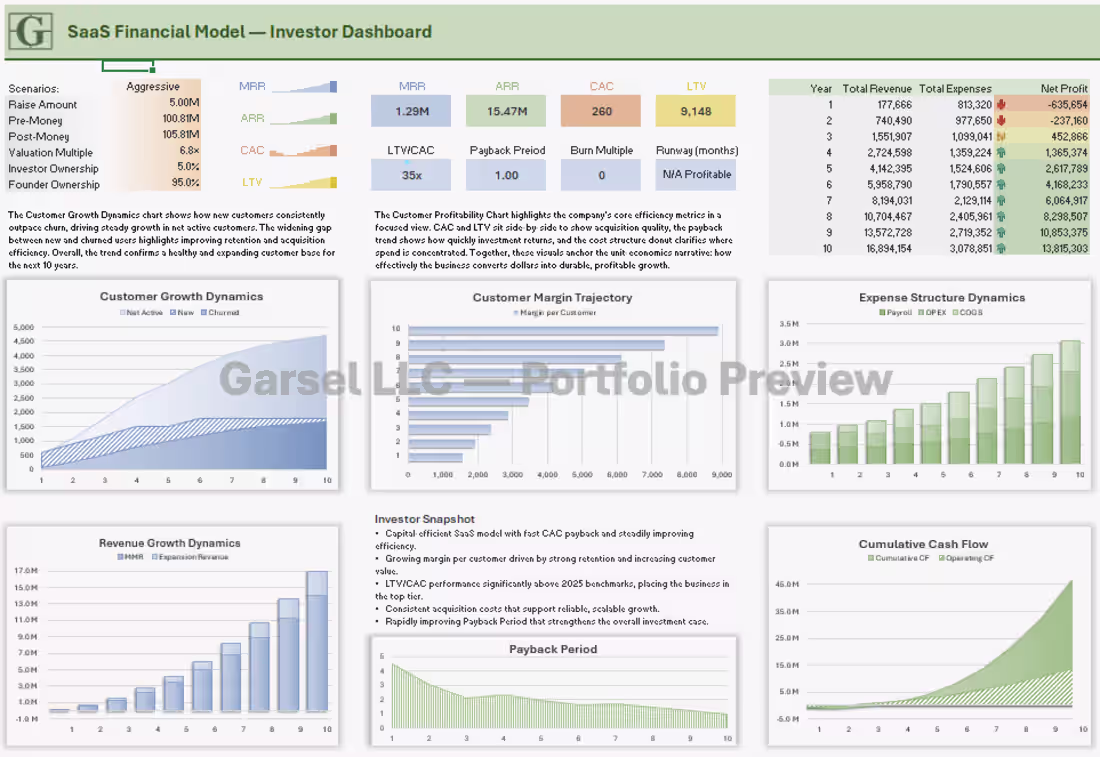
A full SaaS financial model built for investor readiness, combining revenue dynamics, CAC/LTV performance, customer growth, expense structure, and valuation logic into a unified dashboard.
Includes:
• MRR, ARR, CAC, LTV, LTV/CAC, and payback period
• Customer growth dynamics (new, churned, net active)
• Expense structure across payroll, OPEX, and COGS
• Revenue growth and expansion revenue modeling
• Valuation, burn multiple, runway, and cumulative cash flow
1
59
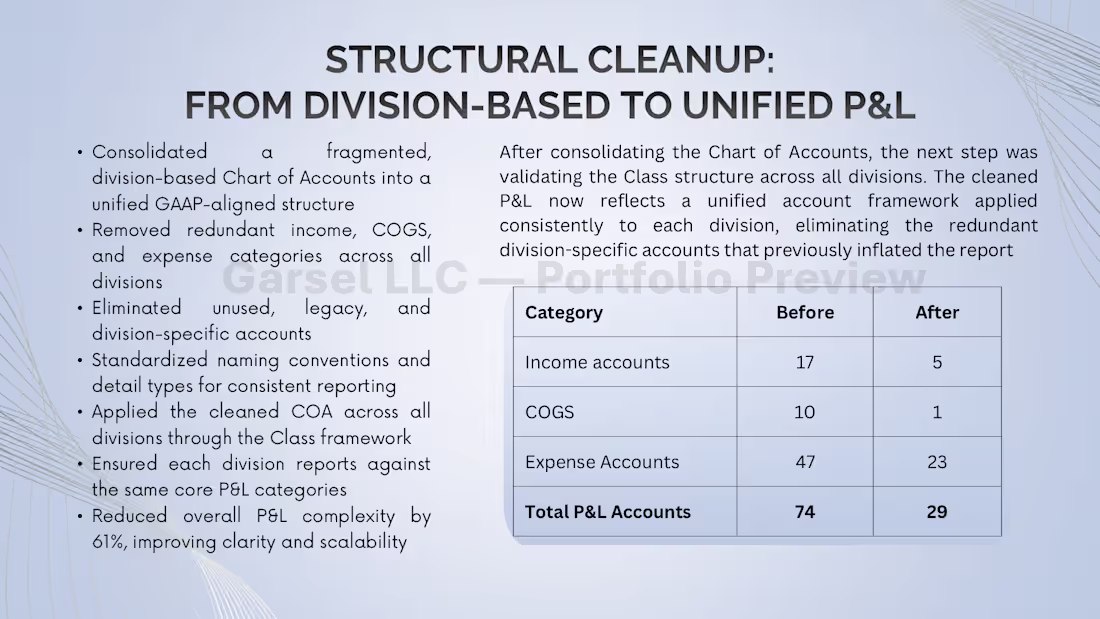
QBO Cleanup Case Study - Before & After Transformation
A controller‑grade QBO cleanup transforming a fragmented, division‑based file into a unified, GAAP‑aligned accounting system.
Includes:
• Rebuilt Chart of Accounts with standardized naming
• Consolidation of duplicate, legacy, and unused accounts
• Structural remediation across income, COGS, and expense categories
• Unified Class‑based reporting architecture for all divisions
• Clean, scalable foundation for accurate monthly reporting
1
68