
Lynda Ugwuanyi
Data Analyst turning data into real world solutions
New to Contra
Lynda is building their profile!

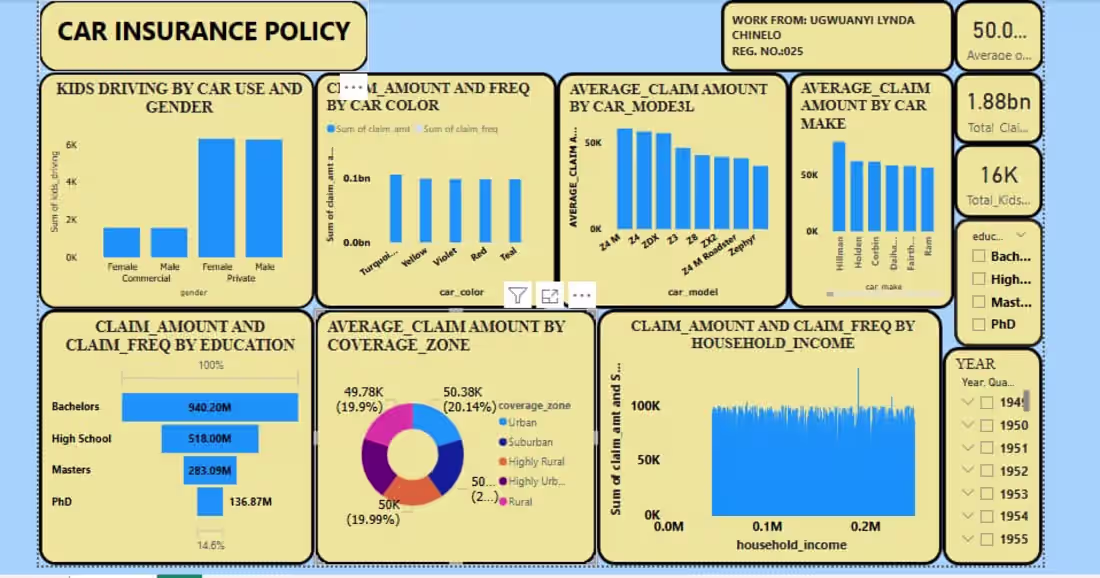
A transformed raw insurance data using Power Query in Microsoft Power BI to ensure data accuracy and consistency. Developed an interactive dashboard to analyze claim amounts, claim frequency, customer demographics, car models, coverage zones, and income impact. Delivered key insights that reveal claim patterns, high-risk segments, and trends to support data-driven decision-making.
0
14
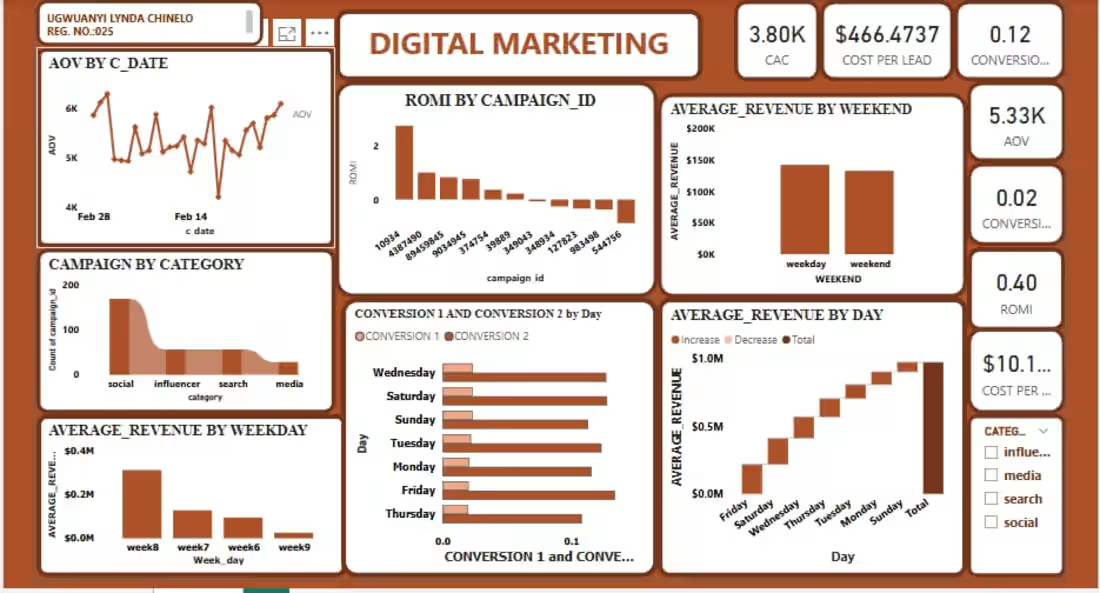
Developed an interactive dashboard in Microsoft Power BI to analyze key marketing metrics, including customer acquisition cost (CAC), cost per lead, conversion rates, and return on marketing investment (ROMI). Visualized campaign performance by category, revenue trends by day and weekend, and conversion patterns to identify high-performing channels and optimize marketing strategies.
0
24
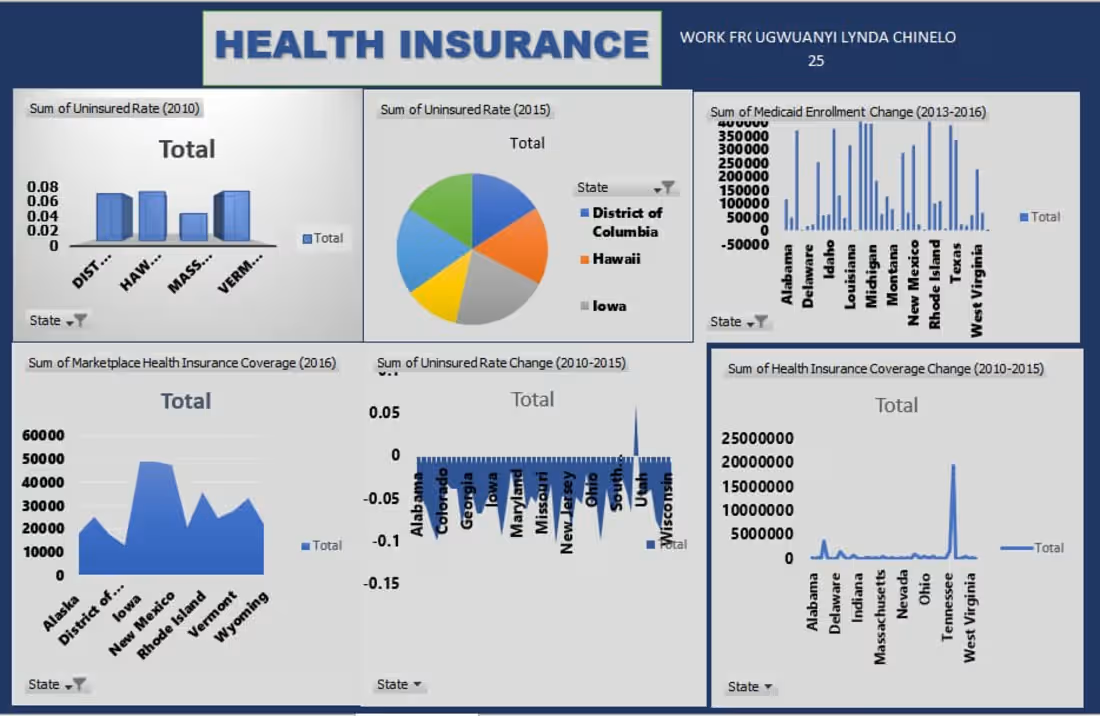
A clean and transformed health insurance data in Microsoft Excel and developed an interactive dashboard to analyze uninsured rates, Medicaid enrollment, and state-level coverage trends (2010–2016), delivering insights into coverage shifts and expansion patterns over time.
0
20
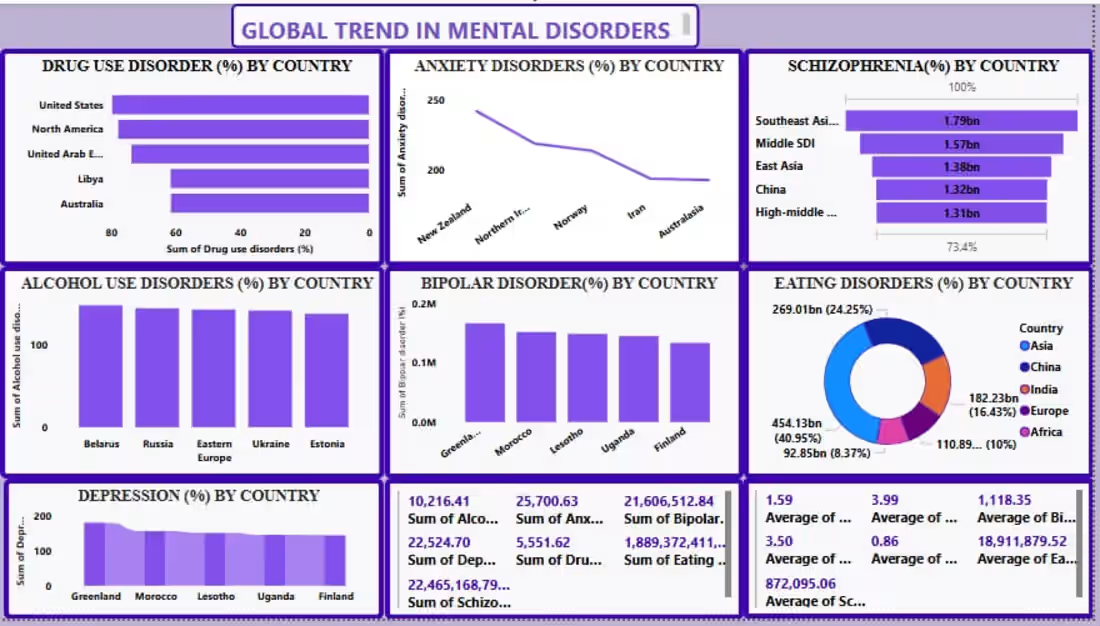
An cleaned and transformed global mental health data and built an interactive dashboard in Microsoft Power BI to analyze disorder trends across countries and highlight high-burden regions for comparative insights.
0
27