
Loise Mihari
Data & Business Analyst | Power BI · SQL · Excel | Remote
New to Contra
Loise is ready for their next project!

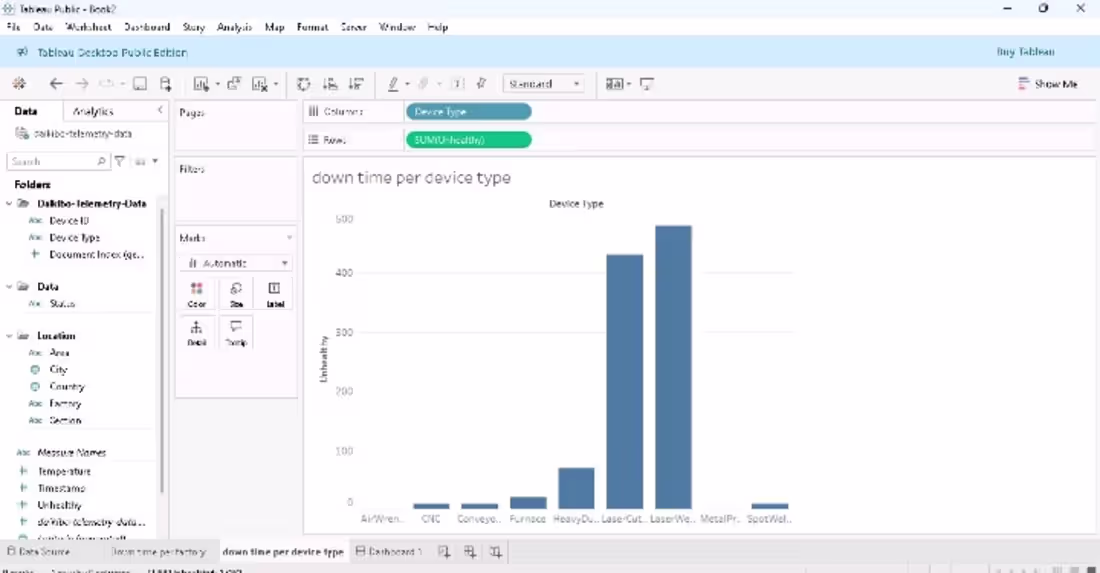
Built Tableau dashboards analyzing machine failure data across 4 global factories to identify the highest-downtime site and most failure-prone equipment — delivered as executive-level findings with maintenance recommendations.
0
12
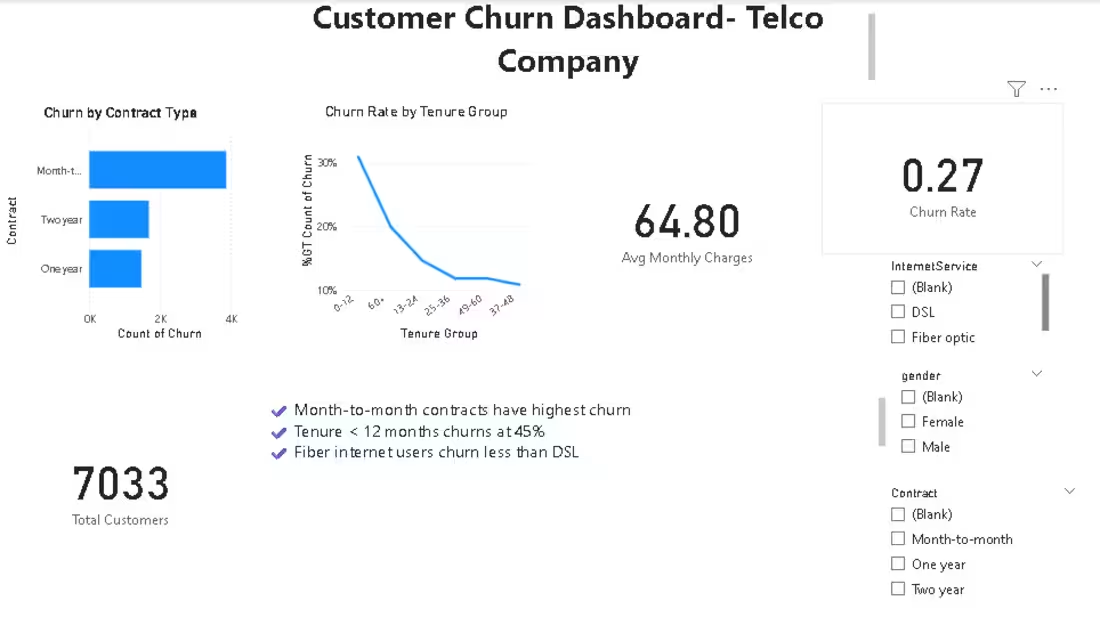
Analyzed customer behavior data to identify churn drivers — found month-to-month contracts carry 3x higher churn risk and built a retention strategy framework from the findings.
0
12
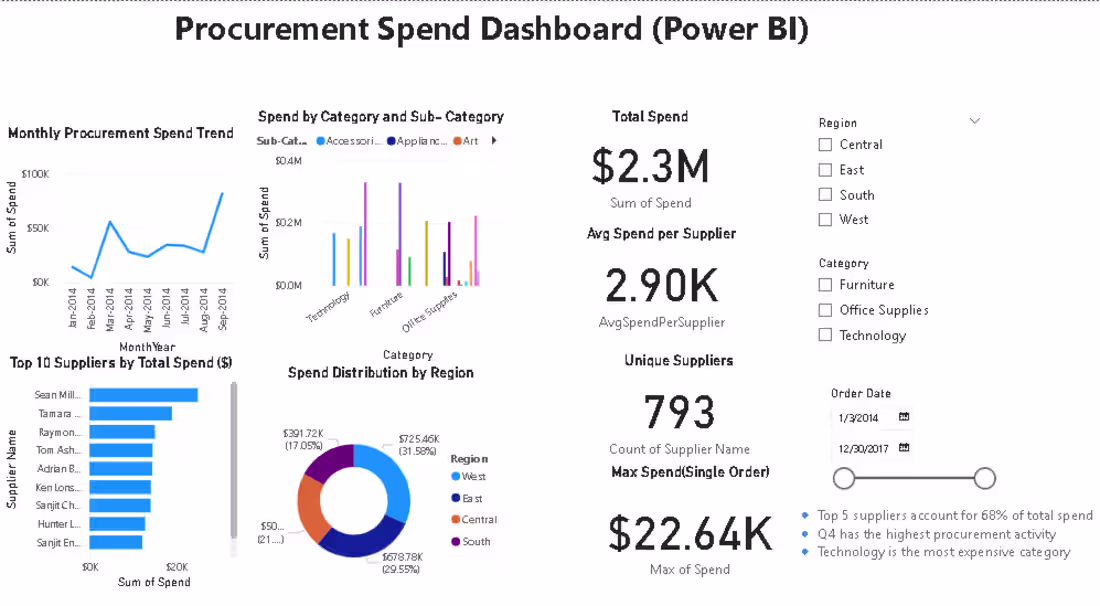
Analyzed $2.3M in procurement spend across 793 suppliers to identify cost risks and optimization opportunities. Built in Power BI and Excel with DAX measures, Power Query, and executive KPI cards.
1
12
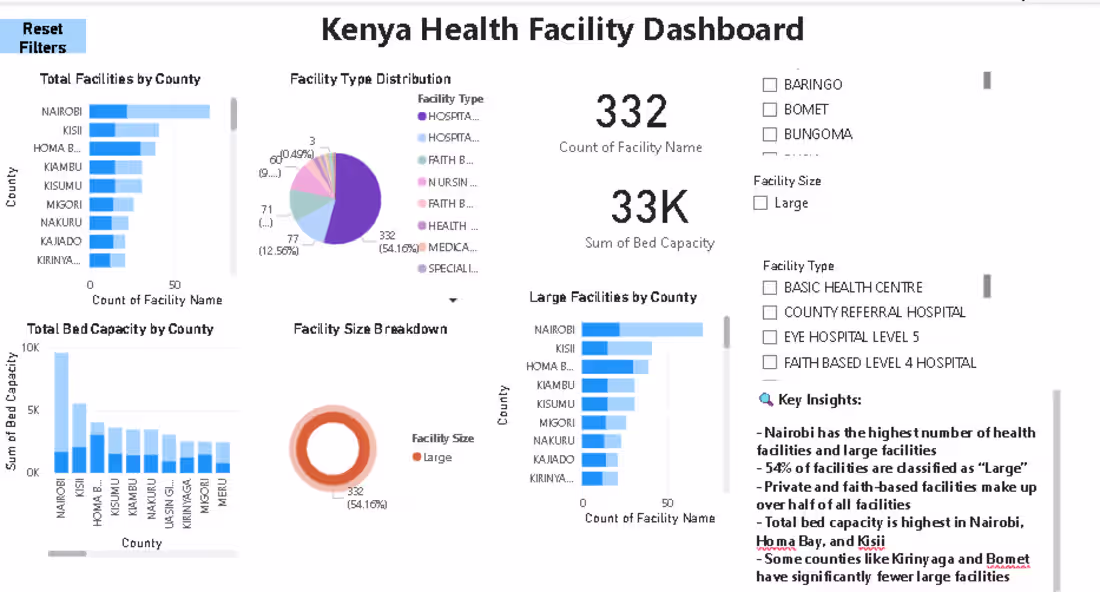
Mapped health facility distribution and performance metrics across Kenya using Power BI. Designed to help stakeholders identify service gaps and prioritize resource allocation.
1
18