
Lamyae Moutanabie
Power BI dashboards that drive business decisions
New to Contra
Lamyae is ready for their next project!
sales dashboard-power bi
1
21
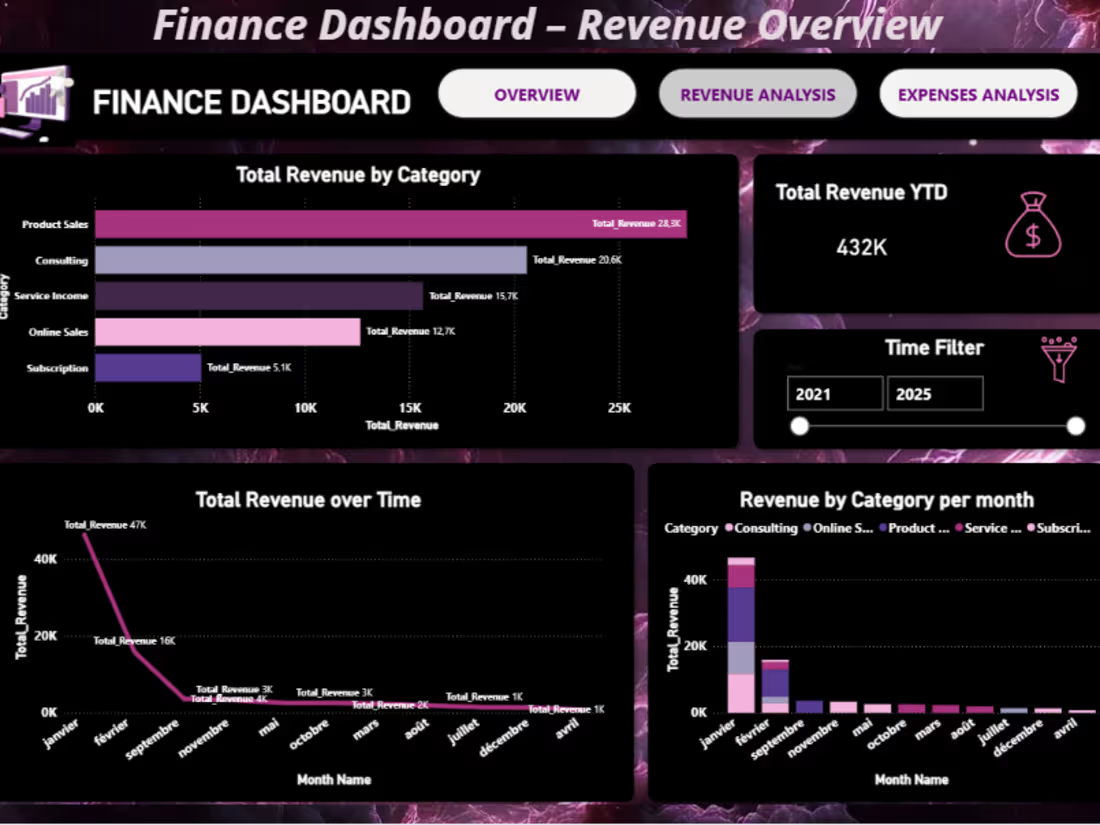
Finance Dashboard - Power BI
This Financial Dashboard helps companies monitor financial performance and key indicators.
It provides insights into profit, expenses, and financial trends through interactive charts and visualizations.
Key features:
• Profit and loss overview
• Expense tracking
• Financial performance indicators
• Interactive data visualization
Tools used: Power BI .
1
34
HR Analytics Dashboard – Power BI
This HR Analytics Dashboard provides insights into employee data and workforce performance.
The dashboard allows HR teams to monitor employee distribution, salary trends, and department statistics through interactive visualizations.
Key features:
• Employee distribution by department
• Salary analysis
• Workforce metrics
• Interactive filters
Tools used: Power BI
1
60
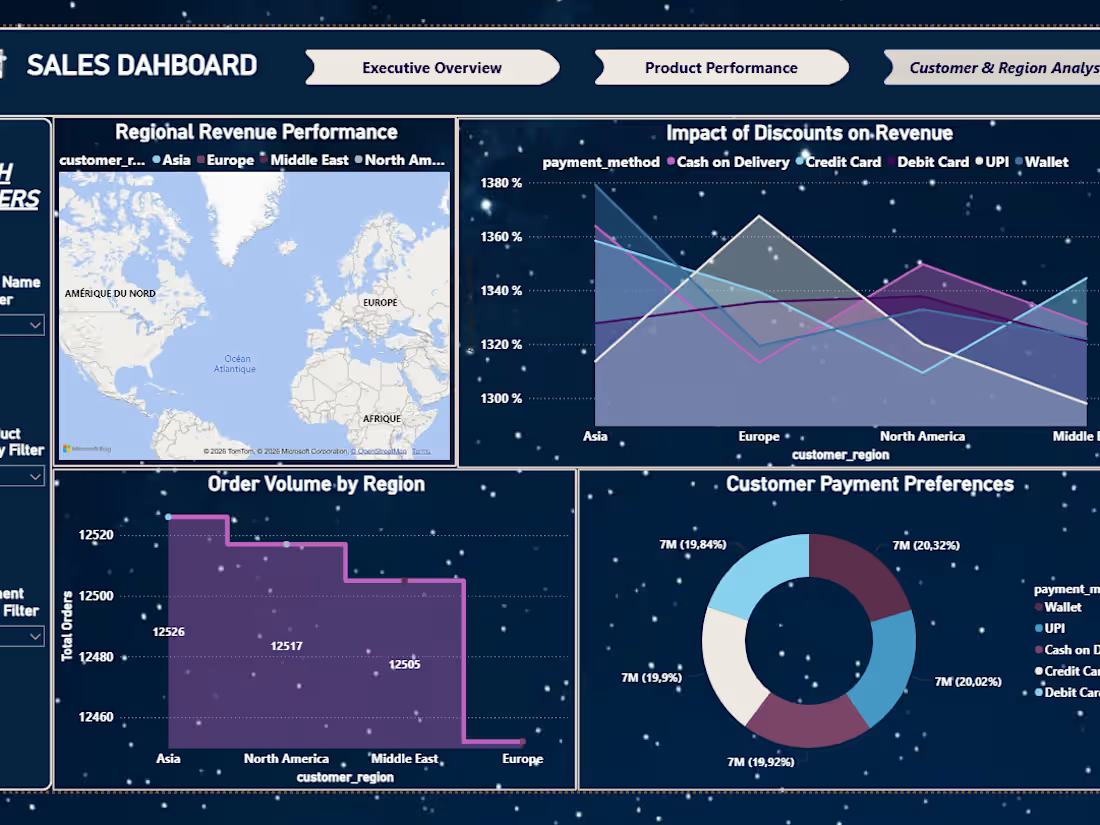
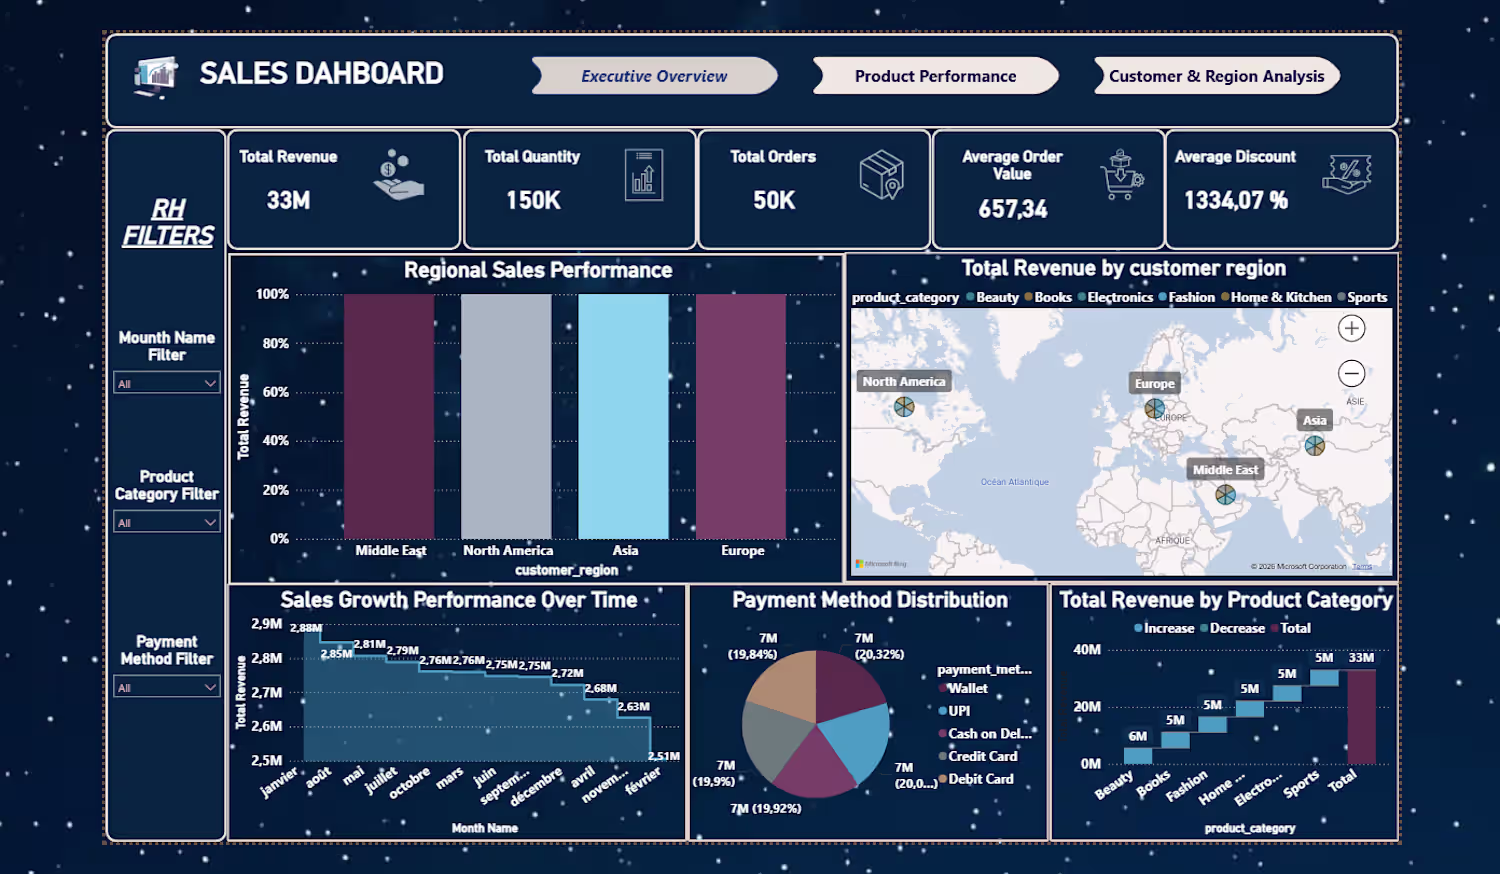
Sales Performance Dashboard – Power BI
This Sales Dashboard helps businesses track revenue, sales performance, and key KPIs.
Features:
• Monthly sales analysis
• Revenue trends
• Top performing products
• Interactive filters
Tools used: Microsoft Power BI
3
86