
Johan Cornelis Adi Saputra
machine learning engineer and data scient
New to Contra
Johan Cornelis is building their profile!
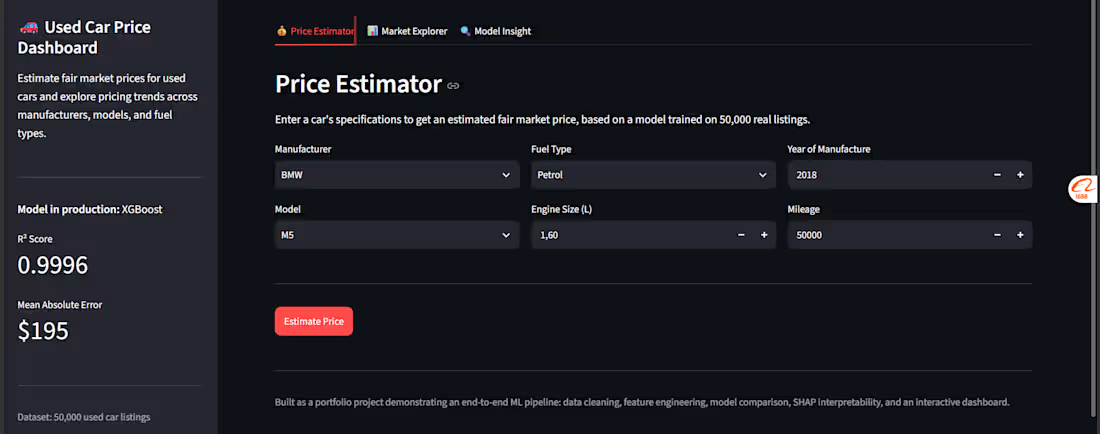
Built an end-to-end used car price prediction system using regression on a dataset of 50,000 used car listings (manufacturer, model, engine size, fuel type, year, mileage, and price).
I compared three models, linear regression, random forest, and XGBoost, and selected XGBoost as the production model based on its strong performance (MAE ~$195, R² 0.9996). Feature engineering included car age, mileage per year, and a premium-brand flag to boost predictive accuracy. SHAP was used to interpret the model, revealing that car age, engine size, and mileage are the strongest drivers of price.
The final model is deployed as an interactive Streamlit dashboard with three sections: a Price Estimator for instant valuations, a Market Explorer for browsing trends across brands/models, and a Model Insight page showing feature importance and evaluation metrics.
Built end-to-end using Python, pandas/numpy, scikit-learn, XGBoost, SHAP, Streamlit, and Plotly.
1
15
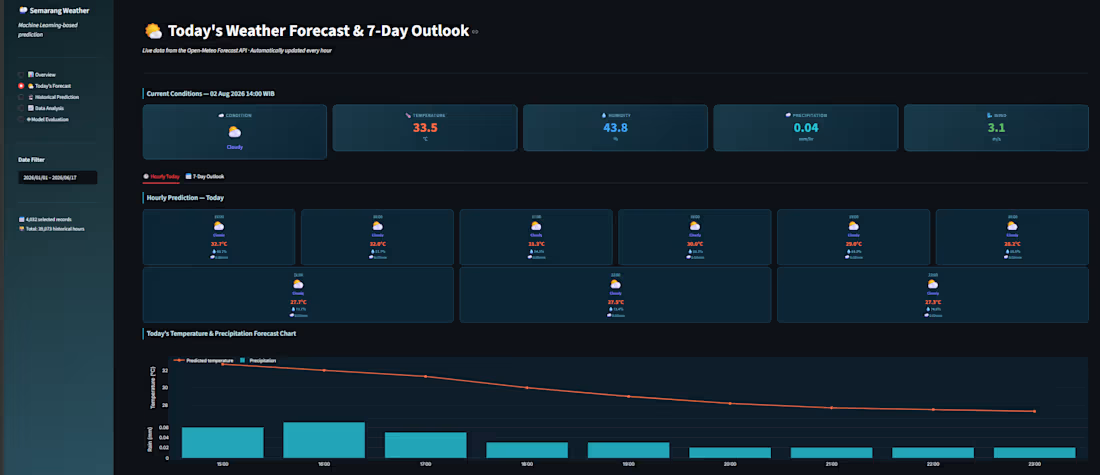
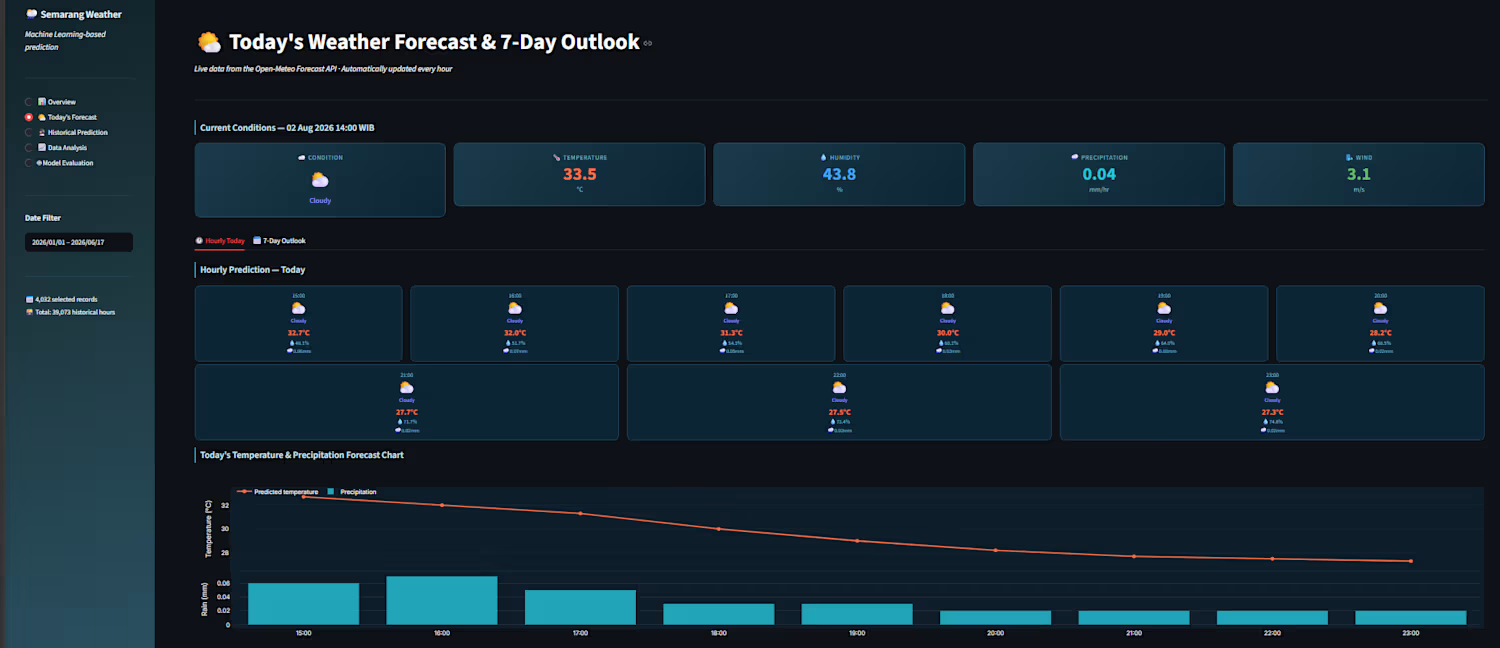
Built an end-to-end ML weather forecasting system for Semarang, Indonesia, combining two models: a Random Forest Regressor for temperature, humidity, precipitation, and wind speed, and an XGBoost Classifier for weather category (Clear/Cloudy/Light Rain/Heavy Rain).
Trained on ~39,000 hours of historical weather data (2022-2026) from the Open-Meteo Archive API, engineered into time-based and lag/rolling features. Data was split temporally (80/20) to avoid leakage across time.
On the test set, the regression model achieved R2 of 0.96 for temperature and 0.95 for humidity, while the classifier reached ~73% accuracy across four weather categories.
The system is deployed as an interactive Streamlit + Plotly dashboard with five pages: live forecasts (via Open-Meteo's real-time API), historical predictions, exploratory data analysis, and full model evaluation with feature importance.
1
23
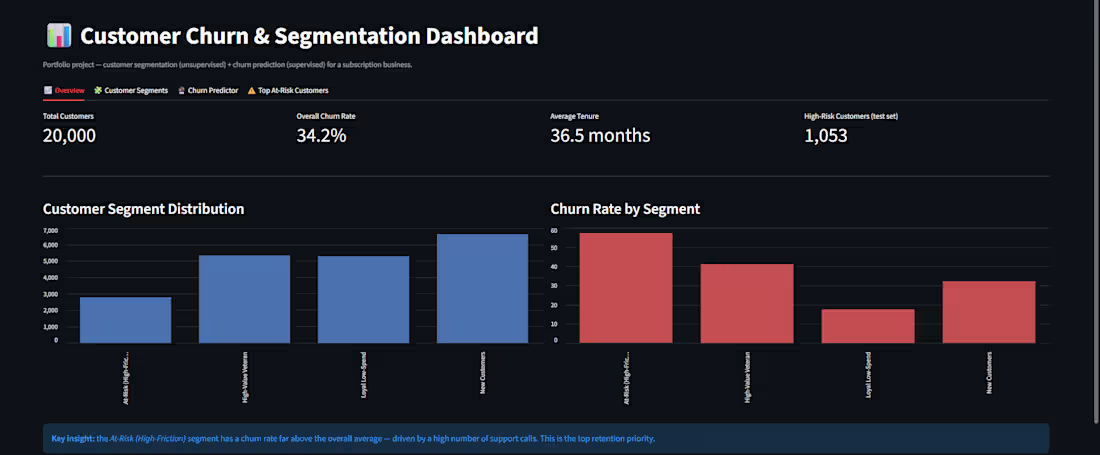
uilt an end-to-end customer churn prediction system using a 20,000-row telecom-style dataset (tenure, monthly charges, contract type, payment method, internet service, support calls, etc.).
The workflow covered data cleaning, exploratory data analysis, stratified train-test splitting, feature encoding (one-hot & binary), and model comparison between Logistic Regression and Random Forest. Model performance was evaluated using precision, recall, F1-score, and ROC-AUC, with SHAP used to interpret which features drive churn risk.
The final model was deployed as an interactive Streamlit dashboard, allowing users to input customer data and get a live churn risk prediction along with the key factors behind it.
This project reflects my focus on building practical, interpretable ML solutions — from raw data to a usable, deployed tool.
0
24