
pro
Jessica McCallum
Data Analyst | Data Cleaning, Reporting & Insights
New to Contra
Jessica is ready for their next project!

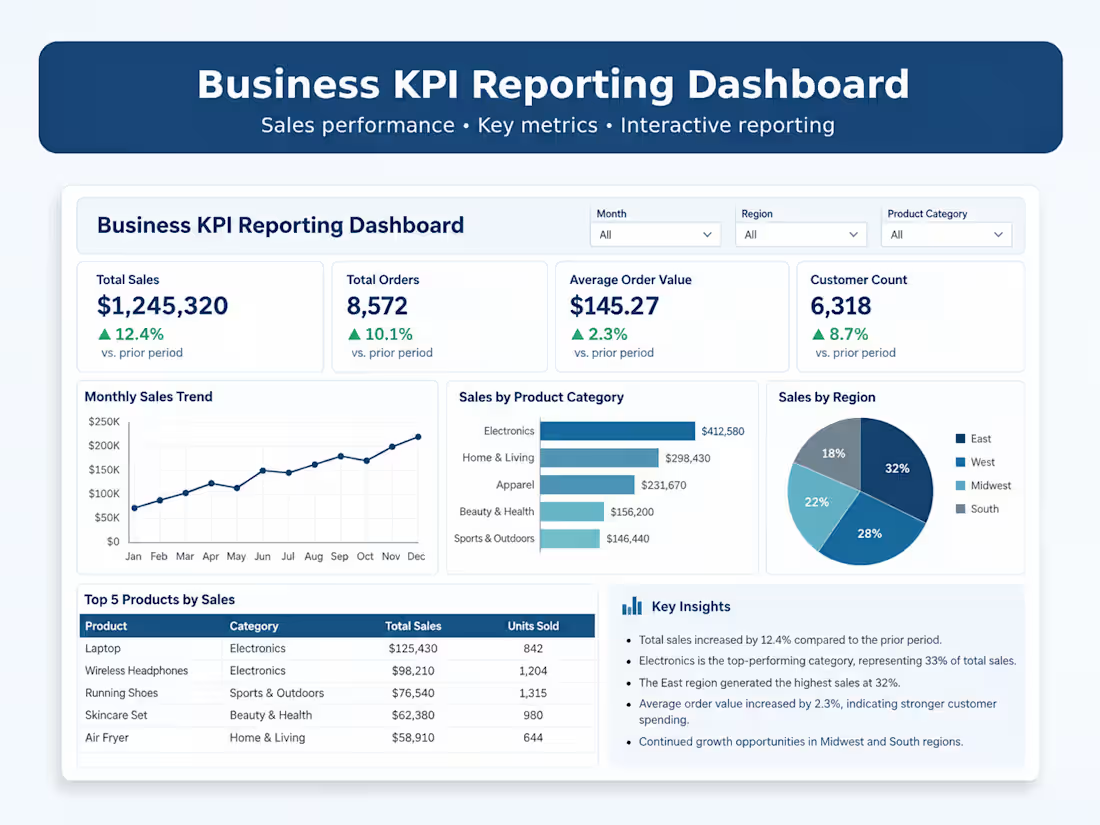
Built a business KPI reporting dashboard using synthetic sales and operations data to demonstrate performance tracking, trend analysis, and executive reporting. The dashboard highlights key metrics including total sales, order volume, average order value, customer activity, product performance, and regional trends.
I organized the data into clear visual summaries designed to help stakeholders quickly identify performance changes, top-performing areas, and opportunities for improvement. This self-directed project demonstrates my approach to turning raw business data into practical, decision-ready reporting.
Tools/skills: Excel, KPI reporting, data visualization, trend analysis, business reporting, and performance analysis.
1
9
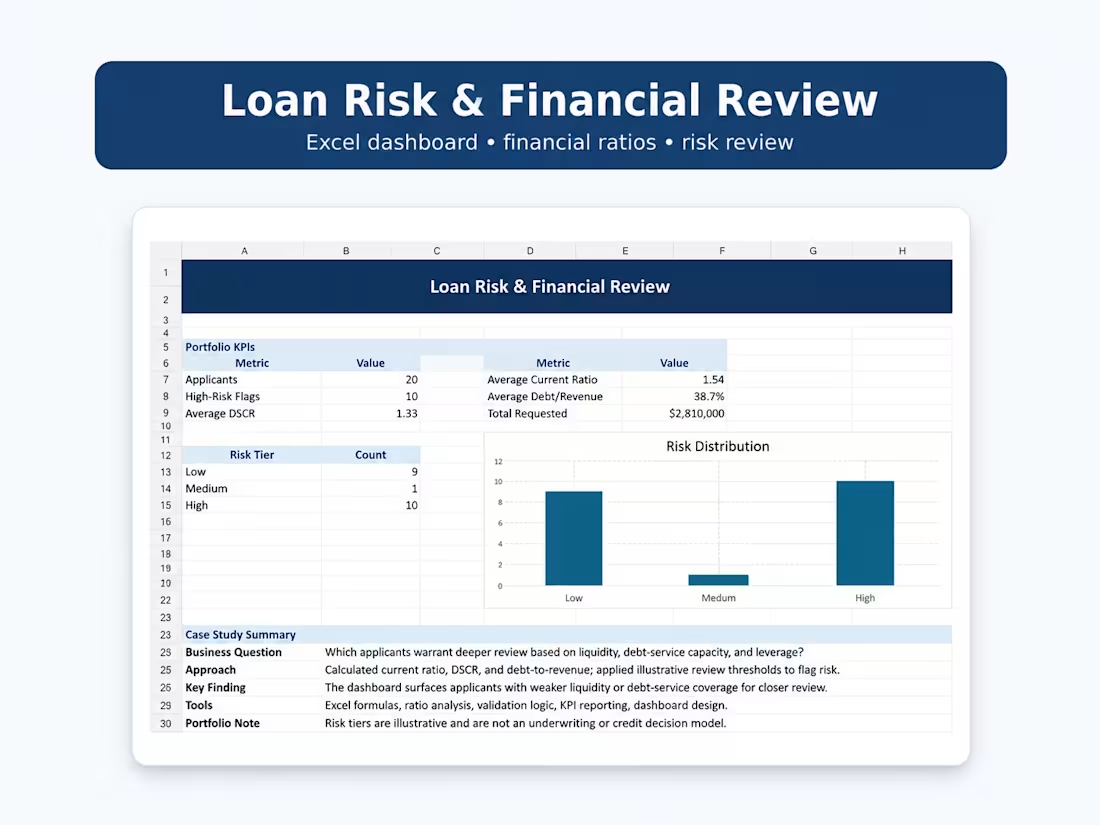
Built a financial-risk review using synthetic business data to evaluate liquidity, debt-service capacity, leverage, and potential risk indicators. Created calculated financial ratios, review flags, and an Excel dashboard to surface applicants requiring deeper analysis. This is a self-directed portfolio simulation and not a credit-decision model.
0
11
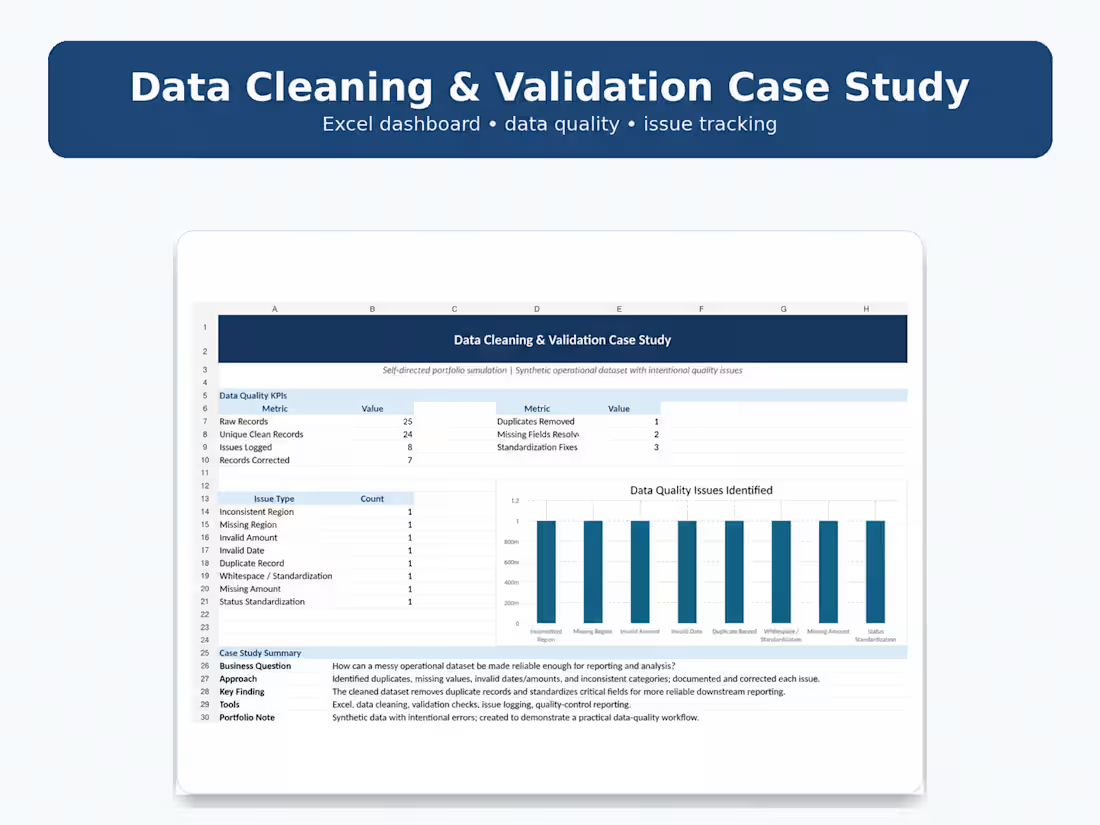
Cleaned and validated a synthetic operational dataset containing duplicate records, missing values, invalid entries, and inconsistent formatting. Documented each issue, standardized the data, removed duplicates, and created a data-quality summary to demonstrate a practical end-to-end cleaning and validation workflow.
1
19
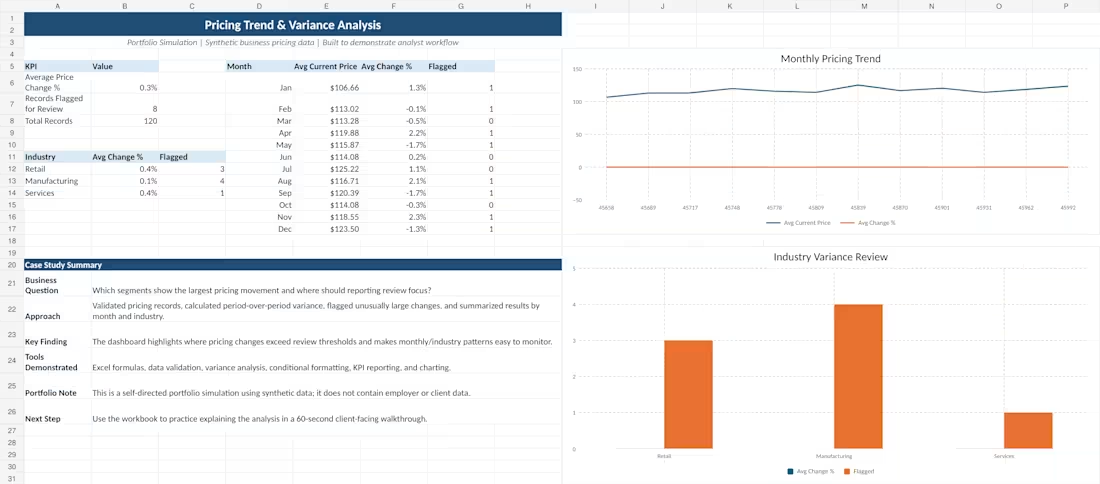
Built a pricing trend and variance analysis using synthetic business data to demonstrate my approach to data validation, trend analysis, anomaly review, and KPI reporting.
I analyzed month-over-month pricing changes, flagged unusual movements, compared performance across industries, and summarized the results in a clear Excel dashboard designed to support business review and decision-making.
Tools used: Excel, data validation, variance analysis, KPI reporting, and data visualization.
This is a self-directed portfolio project created to demonstrate an end-to-end analytical workflow.
1
25