
Ibrahim Killiny
Data Analyst | Power BI Dashboards & Insights
New to Contra
Ibrahim is building their profile!
Superstore Business Intelligence Case Study
An end-to-end Business Intelligence project built with Power BI to transform raw transactional data into actionable business insights and strategic recommendations.
This case study analyzes sales performance, profitability, customer behavior, and operational efficiency through interactive dashboards and executive reporting.
Key Highlights:
• Defined the business problem and stakeholder requirements.
• Built interactive dashboards for Sales, Profitability, and Customer & Operations analysis.
• Developed KPIs using DAX and data modeling techniques.
• Identified profitability drivers and loss-generating factors.
• Analyzed the impact of discounts on business performance.
• Delivered executive insights and data-driven recommendations.
Tools & Technologies:
Power BI • Power Query • DAX • Data Modeling • Data Visualization • Business Intelligence
Outcomes:
The project enabled a deeper understanding of business performance, uncovered opportunities for profit improvement, and demonstrated how data can support strategic decision-making.
GitHub:
https://github.com/ebrahimqlini/Superstore-Business-Intelligence-Case-Study
0
2
HR Employee Analysis Page
This page provides a detailed breakdown of individual employee data within the organization, focusing on key attributes such as performance ratings, job roles, department allocation, tenure, salary distribution, and demographic information. It is designed to help HR teams gain a deeper understanding of workforce composition at the employee level.
Through interactive filters and visual insights, the page makes it easy to identify high-performing employees, detect retention risks, and analyze patterns across different groups. It also supports comparisons between departments and roles to highlight strengths and areas that may need improvement.
Overall, this section turns raw employee-level data into meaningful insights that support better talent management, workforce optimization, and informed HR decision-making.
0
7
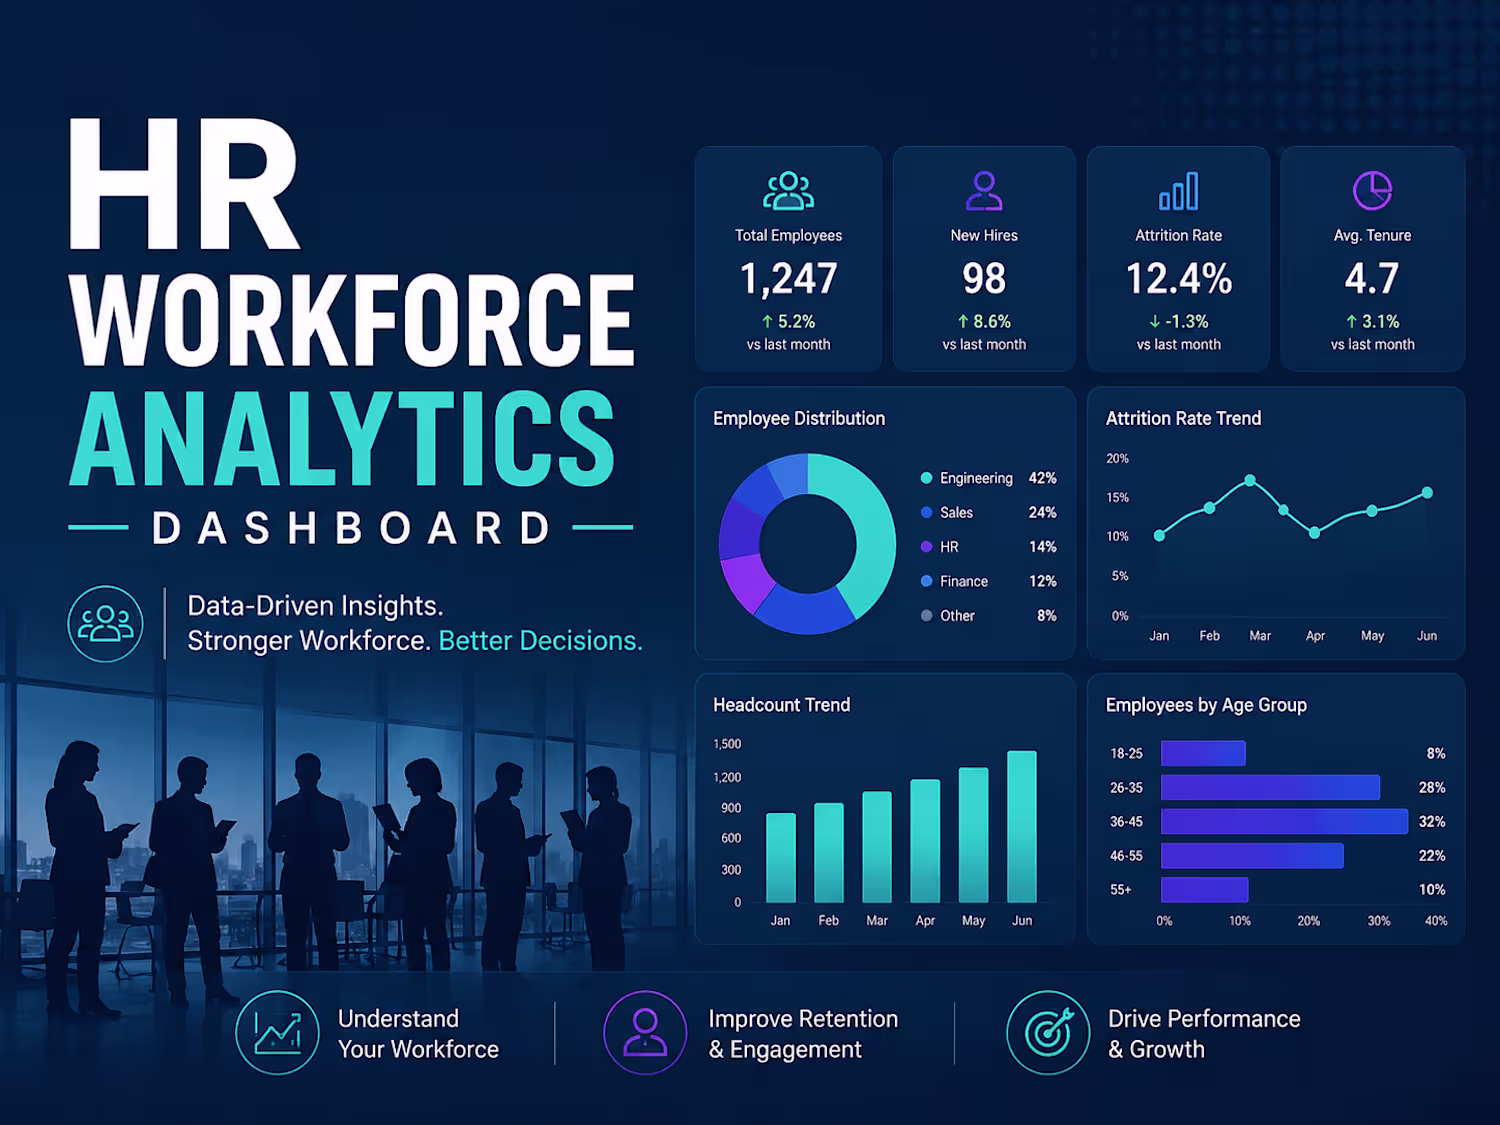
Project Details: HR Workforce Analytics Dashboard
This dashboard analyzes key HR metrics such as employee attrition, performance, demographics, and department distribution. It helps identify workforce trends and patterns to support better HR planning and decision-making through clear and interactive visual insights.
0
11
HR Workforce Analytics Dashboard
An end-to-end HR analytics project built in Power BI to help management understand workforce distribution, salary patterns, leave behavior, overtime load, and employee growth across countries and departments.
Executive Summary
This project turns a flat employee dataset into an executive dashboard with clear HR KPIs and decision-ready insights.
The analysis shows:
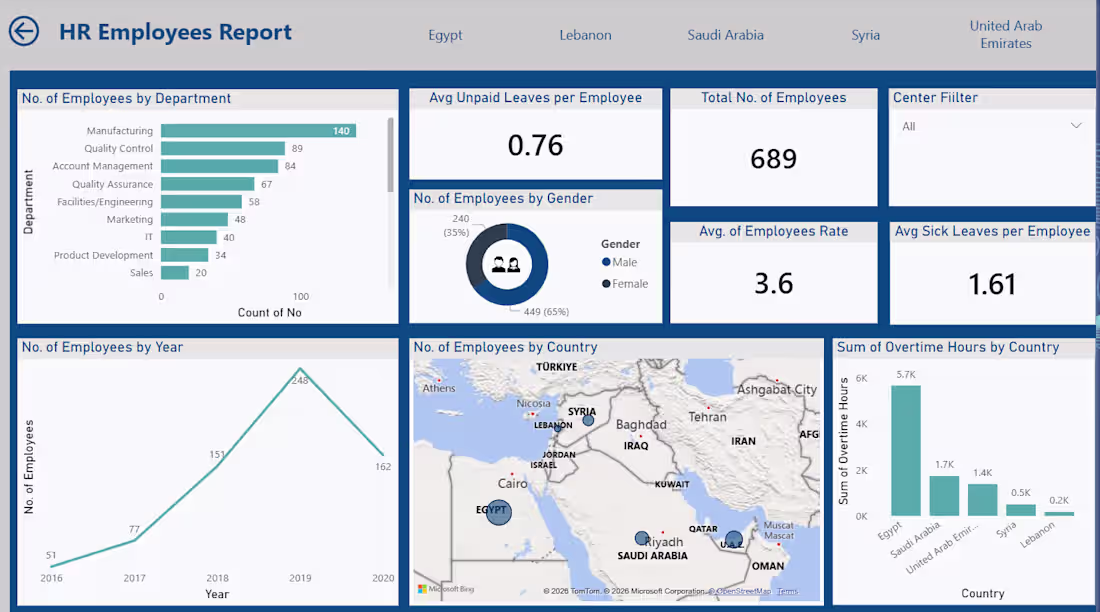
A workforce of 689 employees across 20 departments and 5 countries.
Manufacturing is the largest department, while Egypt has the largest employee base.
Employee growth peaked in 2019, with the largest year-over-year workforce increase.
Average salary is 24.8K annually, with visible variation across departments and countries.
Average sick leave is 1.61 days per employee, and the relationship between overtime and sick leave is essentially negligible in this dataset.
Business Problem
The HR team lacked a centralized view of workforce metrics, which made it difficult to monitor employee trends, compare departments, and support strategic decisions around staffing, compensation, and workload planning.
Project Objectives
Monitor workforce KPIs in one place.
Analyze employee distribution by department, country, and gender.
Track salary and leave patterns.
Identify workforce trends over time.
Highlight areas that require management attention.
Dataset Snapshot
Rows: 689 employees
Columns: 15
Missing values: 0
Duplicate rows: 0
Time span: 2016 to 2020
Countries: Egypt, United Arab Emirates, Saudi Arabia, Syria, Lebanon
Departments: 20
KPI Summary
Total employees: 689
Average performance rating: 3.6
Average sick leaves per employee: 1.61
Average unpaid leaves per employee: 0.76
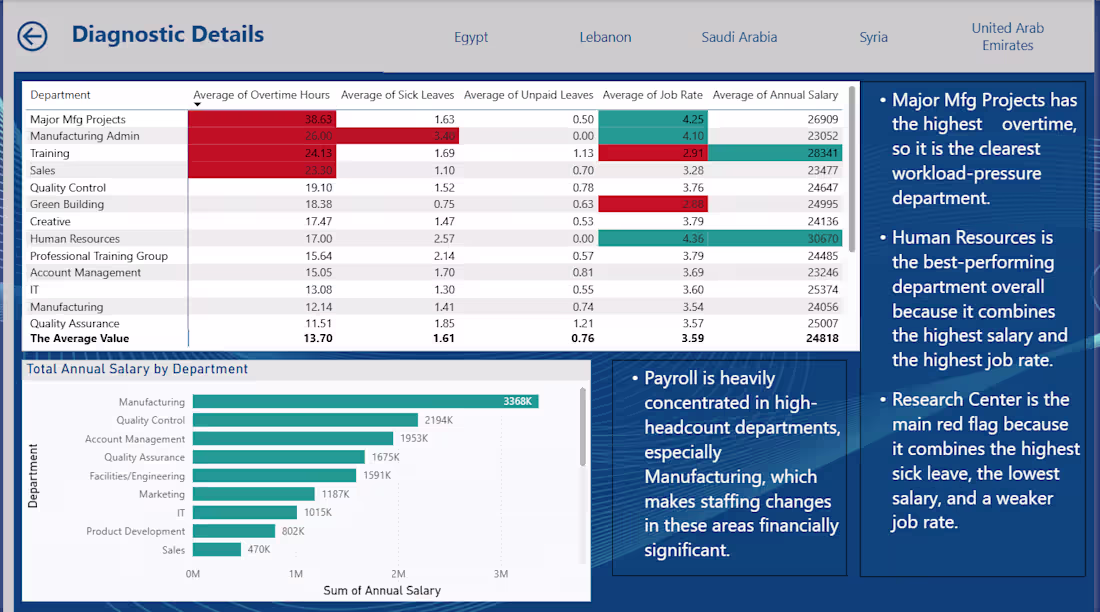
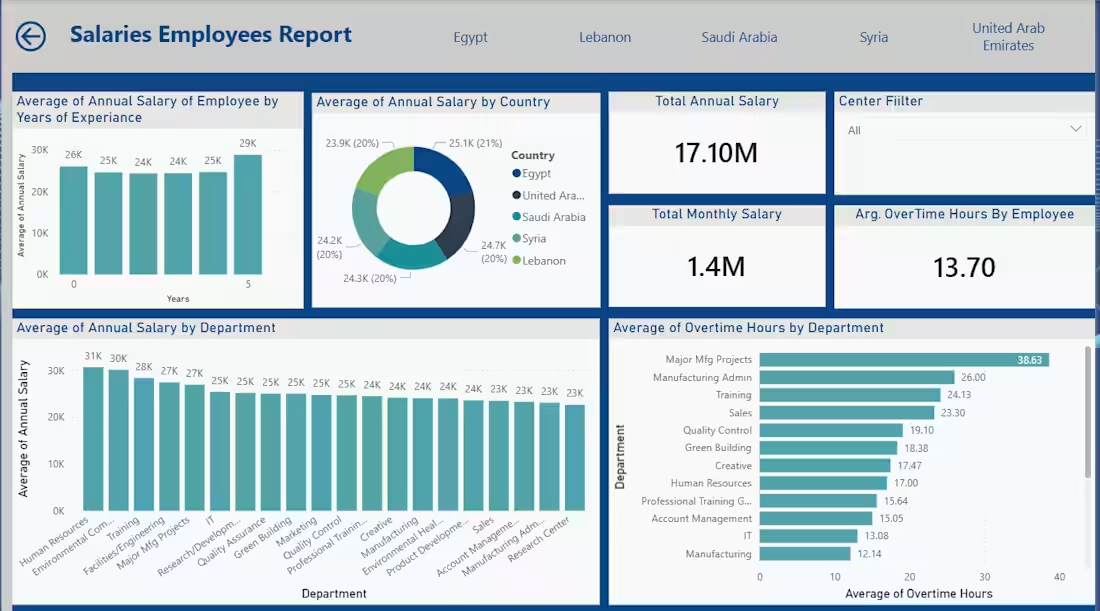
Average overtime hours per employee: 13.70
Total annual salary: 17.10M
Average annual salary: 24.8K
Key Insights
Manufacturing leads headcount
Manufacturing has the largest workforce with 140 employees.
This makes it the most important area for staffing, scheduling, and operational planning.
Egypt dominates workforce concentration
Egypt has 379 employees, the highest count among all countries.
That concentration should be considered when interpreting country-level salary and overtime patterns.
Workforce growth peaked in 2019
Headcount rose from 51 in 2016 to 248 in 2019, then declined to 162 in 2020.
This pattern suggests either a hiring slowdown, restructuring, or a change in staffing strategy after the 2019 peak.
Compensation varies materially by department
Highest average annual salary: Human Resources at about 30.7K
Lowest average annual salary: Research Center at about 22.6K
This gap is meaningful and worth reviewing for internal equity and role alignment.
Overtime and sick leave are not meaningfully linked here
The correlation between overtime hours and sick leaves is approximately -0.03.
In this dataset, overtime does not appear to explain sick leave behavior.
2020 employees show the highest average salary
Employees who started in 2020 have the highest average annual salary in the dataset.
That may indicate a changed hiring mix, revised pay structure, or both.
Recommended Actions
Review salary bands by department to check for consistency and internal equity.
Investigate the 2019 to 2020 workforce drop to understand whether it was driven by attrition, restructuring, or hiring policy changes.
Segment leave analysis by department and country to identify localized absenteeism patterns.
Add turnover, tenure, and promotion data in a future version to make the dashboard more strategic.
Convert the current descriptive dashboard into a more diagnostic HR performance model with drill-through pages and trend comparisons.
Dashboard Pages
Business Problem - explains the context and challenges.
Business Requirements - documents the questions the dashboard is designed to answer.
HR Employees Report - headcount, gender, country, leave, overtime, and growth analysis.
Salaries Employees Report - salary distribution by year of experience, country, department, and overtime.
Diagnostic Details - highlights workload pressure, leave patterns, performance alignment, and payroll concentration by department.
Summary Report - executive-level narrative summary of the main findings.
Tools Used
Power BI
Power Query
DAX
Limitations
The dataset is a snapshot, so it does not include turnover, exit reasons, or promotion history.
Correlations shown in the dashboard should not be treated as causal relationships.
Country comparisons should be interpreted carefully because the sample is uneven across locations.
0
15
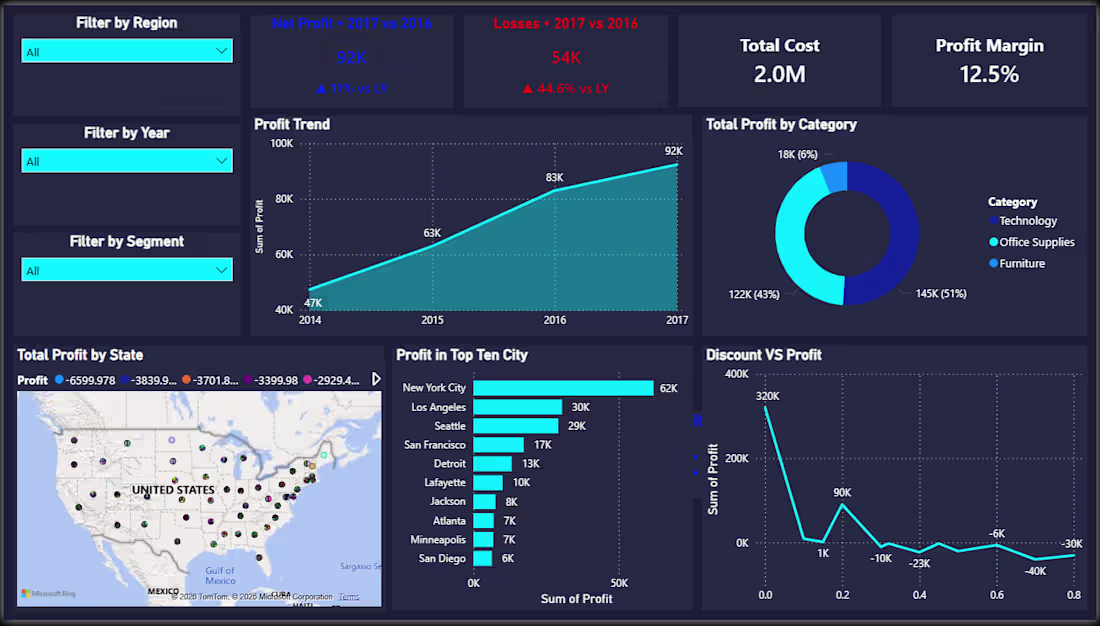
Wide World Importers: Sales Performance & Financial Analysis
Business Problem
The organization faced a critical challenge: raw, fragmented enterprise data that lacked actionable visibility. Specifically:
Lack of Performance Visibility: Unable to distinguish between high-performing and underperforming sales regions, hindering strategic resource allocation.
Profitability Blind Spots: No clear correlation between sales volume and net profit, leading to unidentified cost drivers and margin erosion.
Operational Inefficiency: Ineffective analysis of inventory and buying packages, complicating supply chain and distribution management.
The Solution
I engineered an end-to-end analytical solution to transform this data into a strategic asset:
Data Integration & Modeling: Configured a robust Star Schema, establishing a "single source of truth" by linking the central FactSale table to key dimension tables (DimDate, DimCity, DimCustomer, DimStockItem, DimEmployee).
ETL Pipeline: Built an automated Power Query pipeline to standardize headers, enforce strict data typing for calculation accuracy, and perform proactive data cleansing (handling missing values).
Key Insights
The project revealed critical strategic findings that directly support data-driven decision-making:
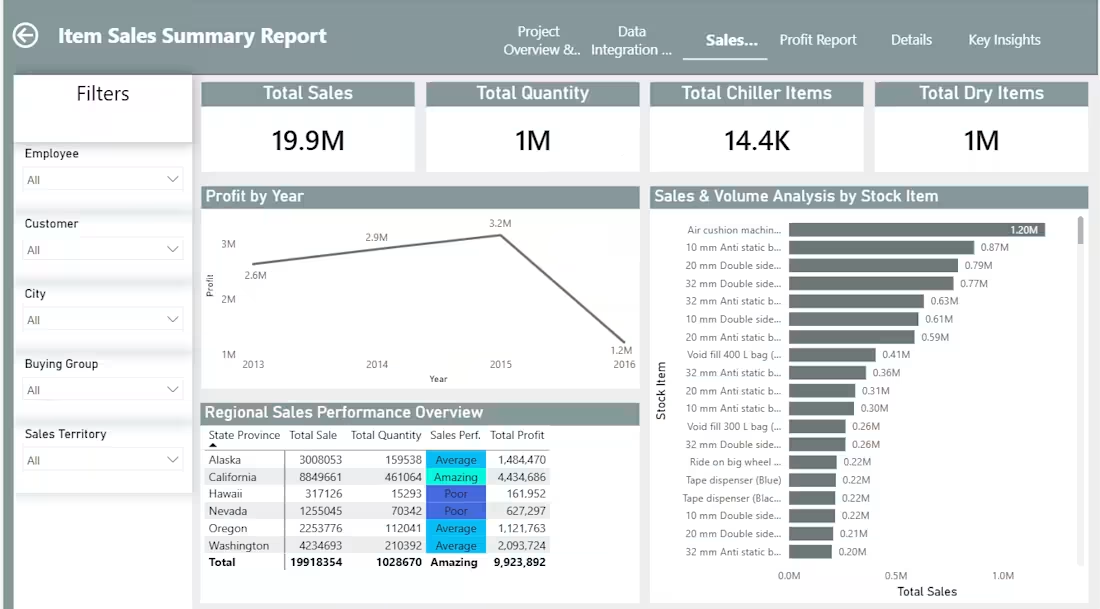
Profitability Trends: Identified a profit peak in 2015 followed by a decline in 2016, highlighting the need for immediate cost structure review.
Regional Disparities: Highlighted California and Washington as primary revenue drivers, while identifying Hawaii as an area requiring localized sales intervention.
Product Efficiency: Correlated sales volume with COGS to prioritize high-margin stock items.
Logistics Optimization: Discovered that one specific buying package drives 70.29% of volume, providing a clear target to streamline distribution processes.
Technical Skills Demonstrated
Data Engineering: ETL pipeline design, data cleaning, and relationship management.
Business Intelligence: Converting enterprise raw data into strategic, actionable dashboards.
Analytical Thinking: Translating complex financial data into clear business insights.
0
20