
Frank Corso
Data consultant building pipelines, content, and ML systems
New to Contra
Frank is ready for their next project!
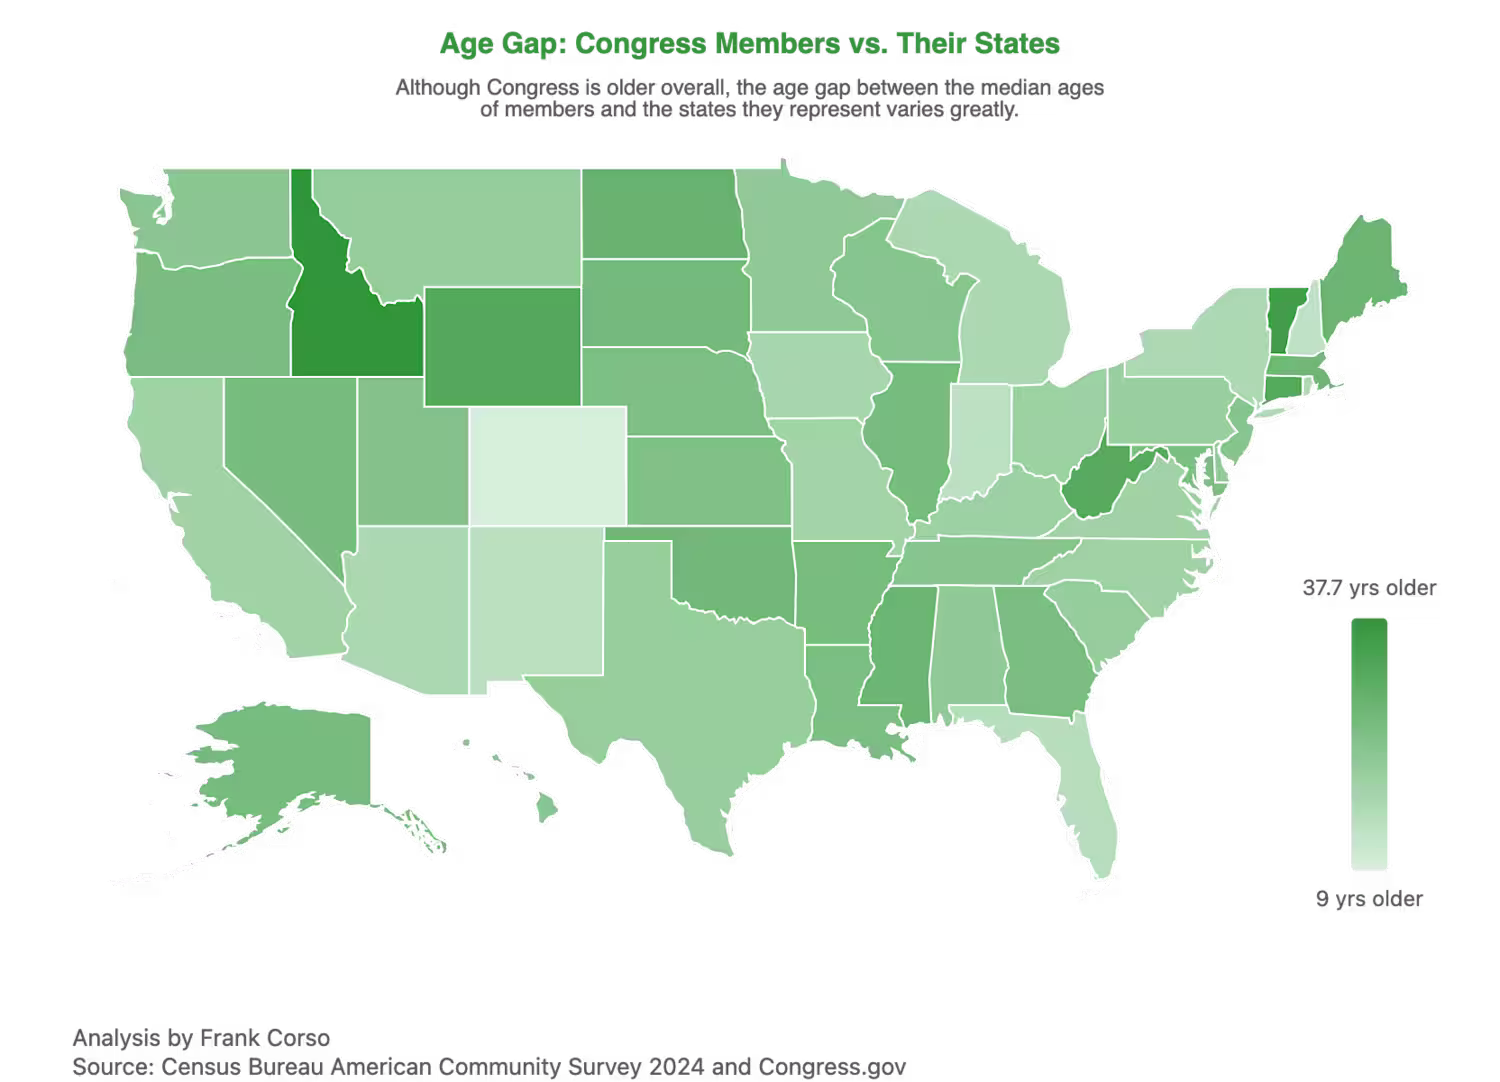
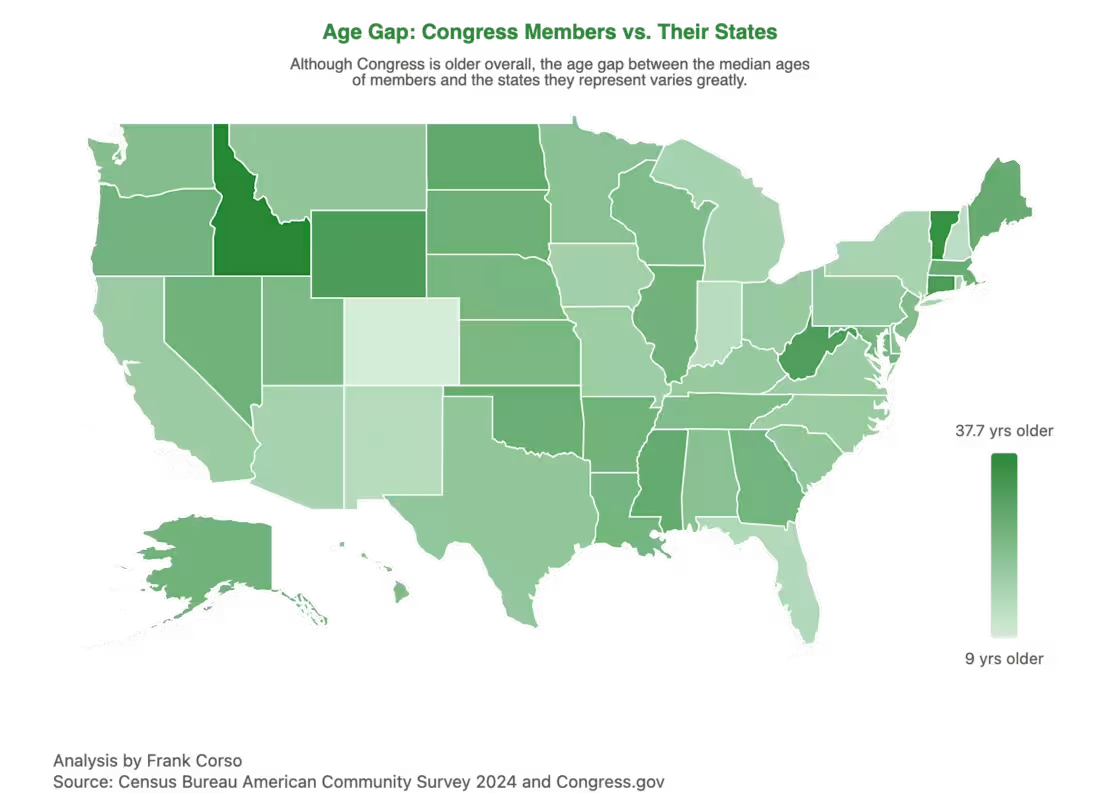
US map showing the difference in median ages between the state's population and the congress members that represent them. Data was collected from Census Bureau csv data and Congress.gov (https://Congress.gov) API. Then data was processed, combined, and restructured to generate needed JSON. Created final interactive chart using Apache Echarts.
1
19
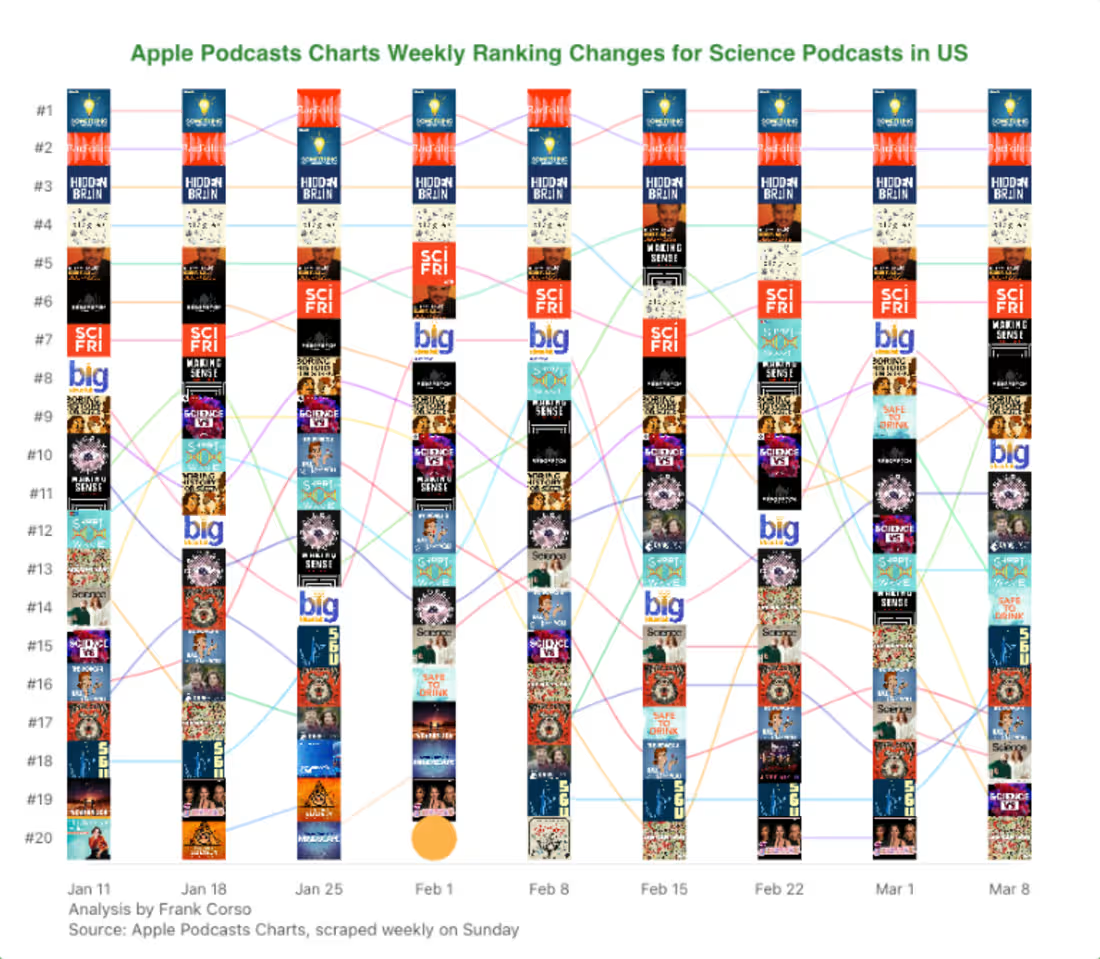
Bump chart showing changes in Apple Podcasts rankings for Science category. Built using data pipelines that scraped data weekly and then created scripts to convert into a simple format and then use Apache Echarts to create the bump chart.
3
100
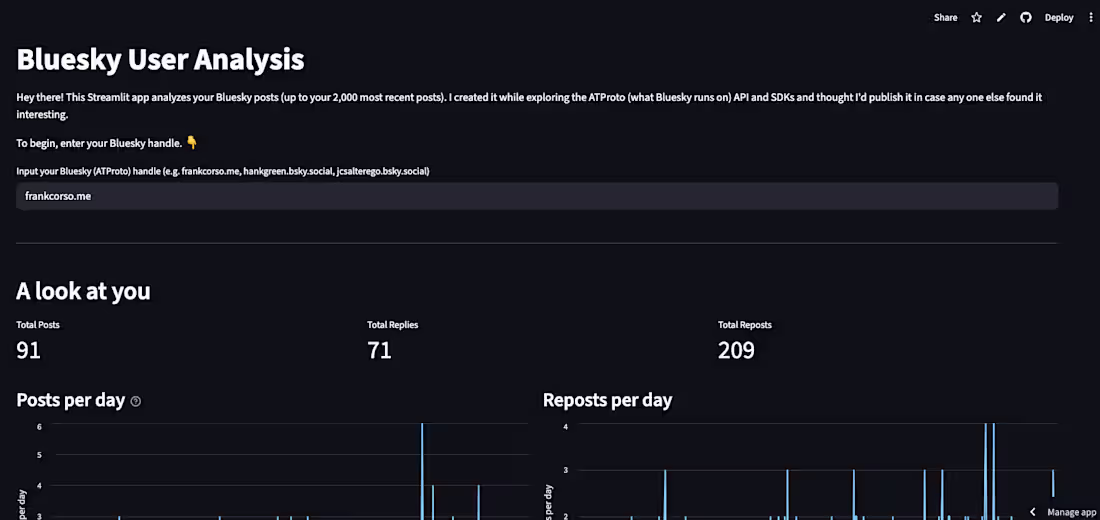
A data app for performing high-level user analysis for a Bluesky user. Can use the tool to review metrics such as posts per day, tags used the most, top posts, and people interacted with the most. Built using Streamlit.
1
30
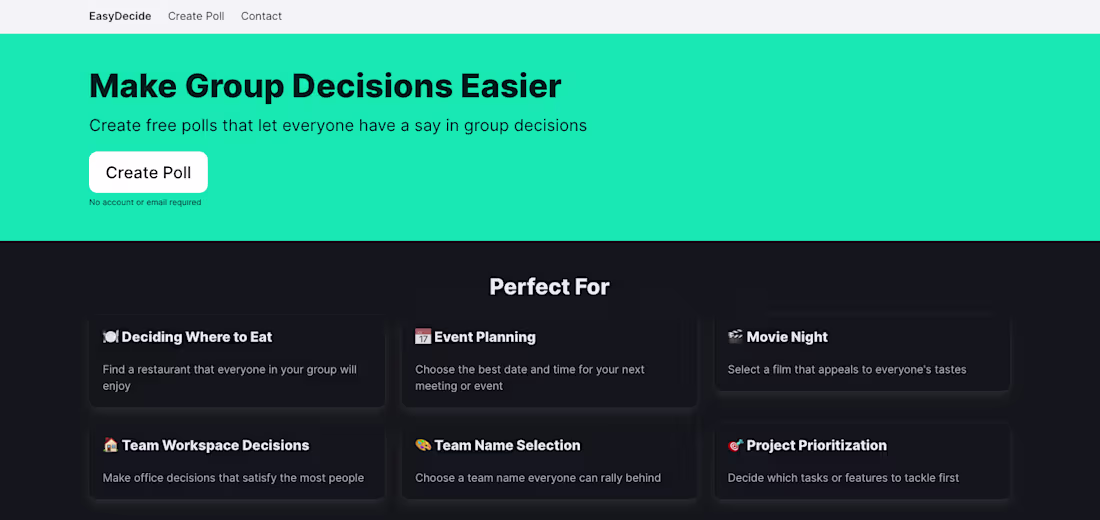
EasyDecide is a free web app that allows teams and organizations to run simple polls where the final winner is picked via ranked choice voting.
0
8