Projects using R
Projects using R
Sign Up
Post a job
Sign Up
Log In
Filters
1
Projects
People
Message
0
Ihar Yanouski
pro
The X-Files fanart infographics
0
17
Message
0
Anastasiya Kotelnikova
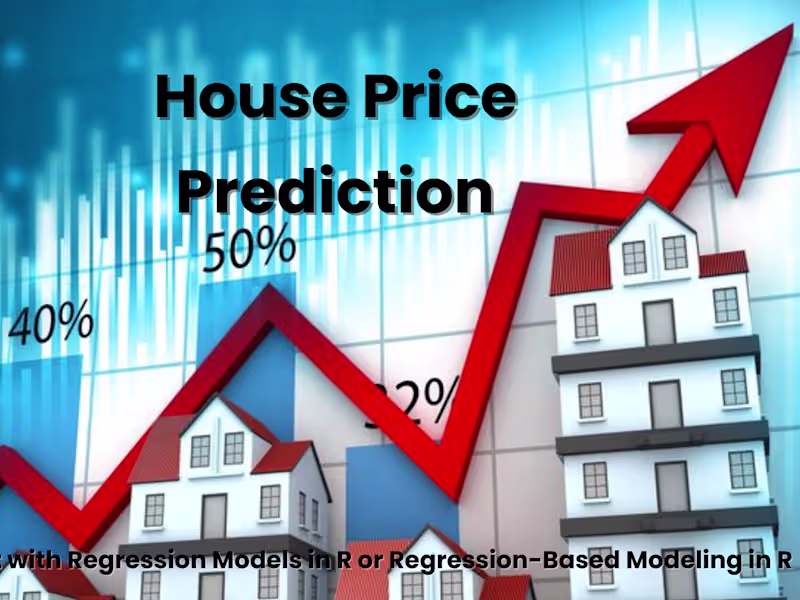
House Price Regression with R
0
14
Message
0
Owar Omot
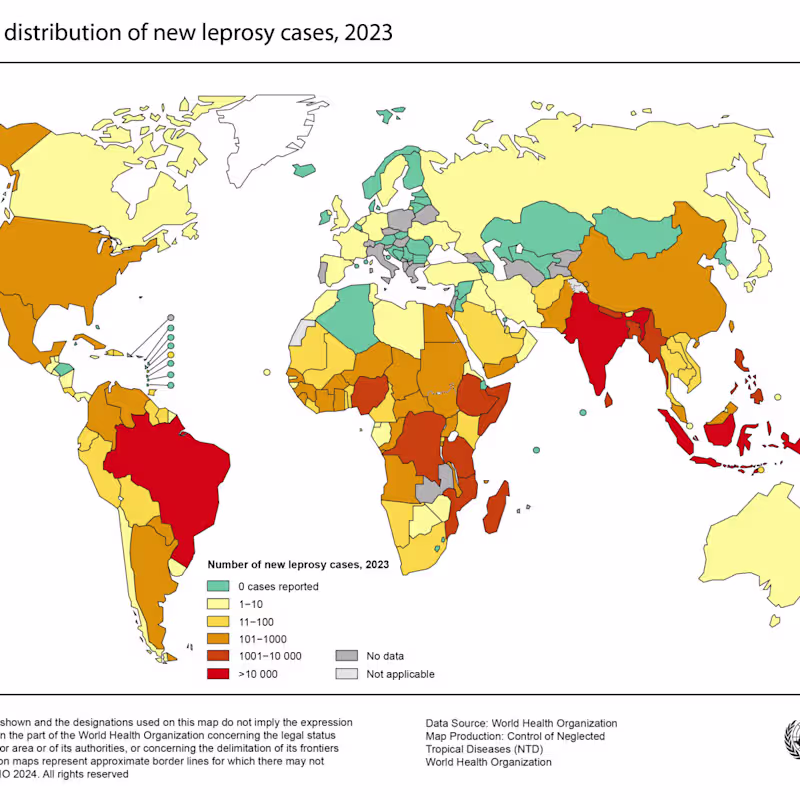
Country Health Rankings
0
6
Message
0
Kaedyn Cruickshank
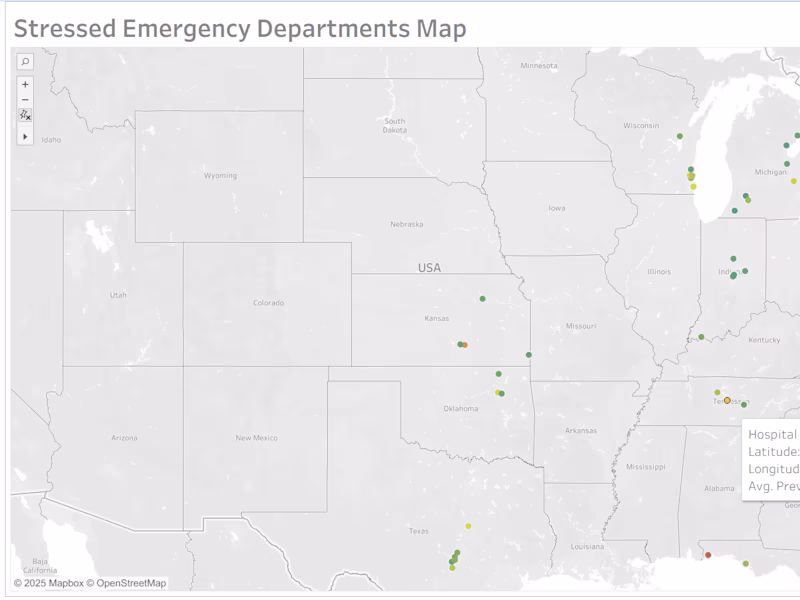
Emergency Resource Allocation Analysis & Dashboard Creation
0
7
Message
1
Leonardo Gonzalez
Case Study: Pricing Strategy for a New Premium Hair Serum
1
7
Message
0
Pooja Mutreja
Time Series Analysis for Walmart Sales Prediction
0
9
Message
0
Tatiana Pilipenko
Medical/Scientific writer to format clinical data tables
0
9
Message
0
Lenara Litmanovich
Psychometric Evaluation of Achievement Program
0
5
Message
3
Muhammad Usman
pro
Website for Workflow AI Artificial Intelligence Company
3
3
258
Message
0
walid elbir
Automation Workflows for Dev And Sales Team
0
70
Message
0
Manideep racharla
Stock Price and Trading Indicators Analysis
0
2
Message
1
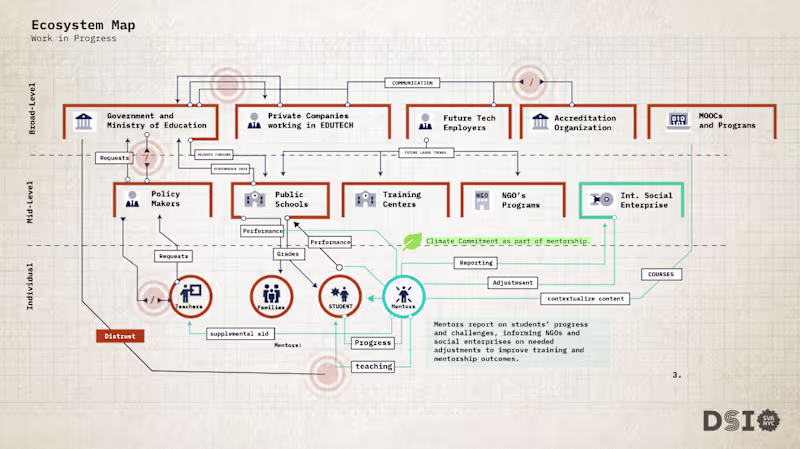
Edwin Mauricio Olivera
Here are some Service design tools that were developed earlier this year for my thesis work. MFA Design for Social Innovation, School of Visual Arts, NYC. I really enjoy making them.
1
1
62
Message
1
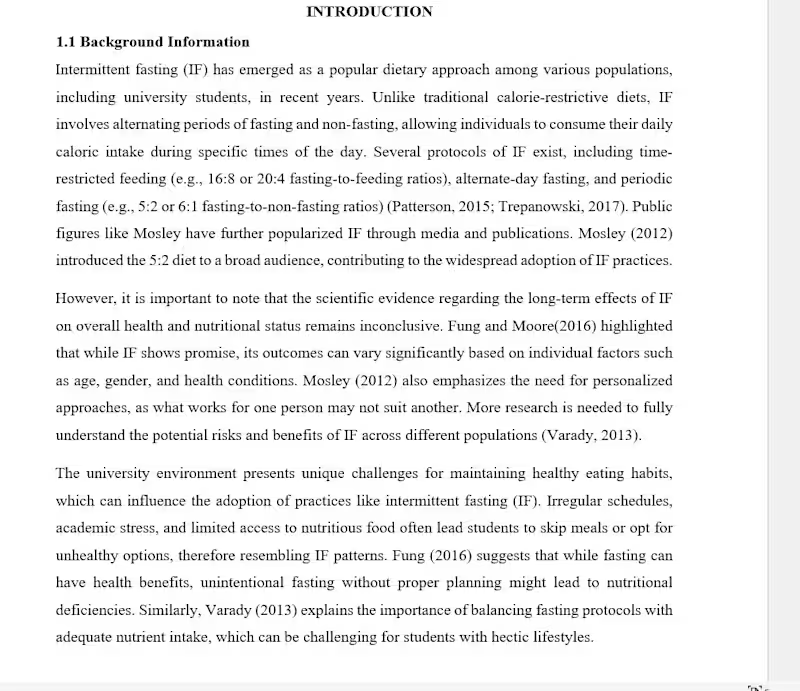
Korir Gloria
This is a snippet of a research report i have written on intermittent fasting. I have the proposal, the data analysis and the interpretation of the results
1
240
Message
2
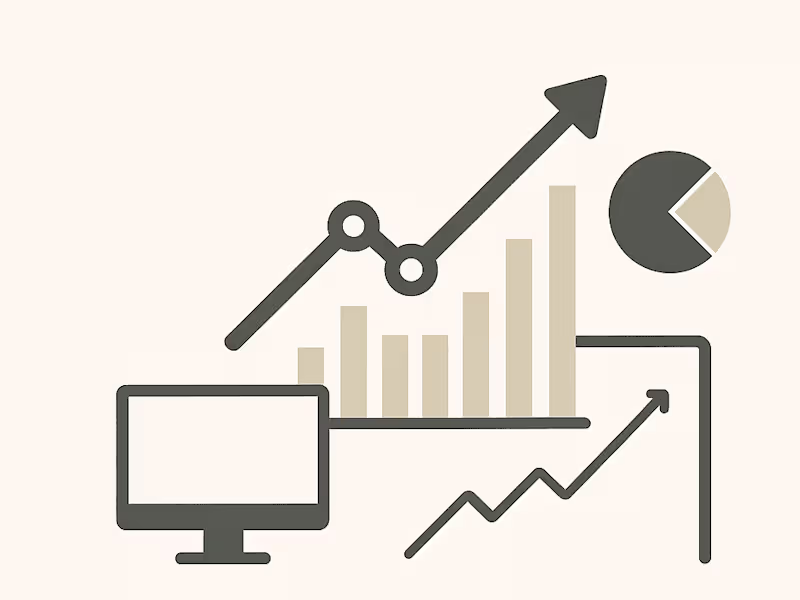
Stefan Automation
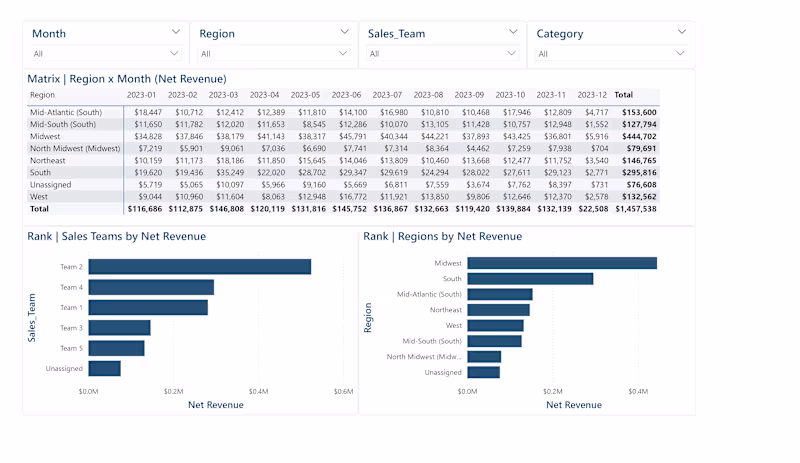
📊 Sales Performance Analytics Dashboard (Power BI) This Power BI dashboard was developed as part of a technical case study to demonstrate a business‑first approach to performance analytics. The report is designed to support both executive‑level decision‑making and operational sales management by focusing on: Revenue performance tracking Key performance drivers (Orders & Average Order Value) Team‑level performance monitoring Individual agent insights Data quality validation and exception handling 🔎 Key Functional Areas Executive Overview Provides a high‑level summary of Net Revenue and its primary drivers, supported by a monthly trend and rolling average to identify emerging performance patterns and reduce short‑term volatility. Performance Diagnostics (Region × Time) Enables root‑cause analysis by highlighting when and where performance changes occurred across regions and time periods. Sales Team Monitoring Supports day‑to‑day management through ranked team performance metrics, enabling prioritization of coaching or follow‑up actions. Agent‑Level Analysis Offers a focused performance view per individual contributor, including category mix and territory‑level revenue drivers. Data Quality Monitoring Separates adjustments (e.g. returns, discounts) from gross performance to prevent misleading KPI interpretation. 💼 Business Value Designed to: Monitor operational performance Identify revenue drivers behind month‑over‑month changes Detect under‑ or over‑performing teams Support targeted coaching Enable fast, data‑driven decision‑making 🛠 Tools & Concepts Used Power BI Data Modeling (Fact / Dimension) KPI Design MoM Analysis Driver‑Based Revenue Monitoring AOV Tracking Data Quality Checks
2
2
154
Message
1
Chhavi Verma
Hi Contra community! Just wrapped a rewarding project for Nauvyashree—delivered deep-dive EDA, custom visualizations, and rich survey sentiment analysis across four datasets. Each milestone included well-designed PDFs packed with clear charts and approachable explanations—making insights accessible for all audiences. I went the extra mile with collaborative Google Meet sessions to walk the client through every analysis, helping connect the findings to big-picture goals. Feedback was fantastic, and milestone-based payments made the process smooth and transparent. This project really strengthened my ability to turn complex results into stories that empower client decision-making. If you want visually engaging, client-focused analytics—or need easy-to-follow reports and hands-on walkthroughs for your next project—let’s connect!
1
81
Message
0
Bryan Munoz
Strategic Growth and Scalable Event Framework for a Global Data
0
14
Explore projects