


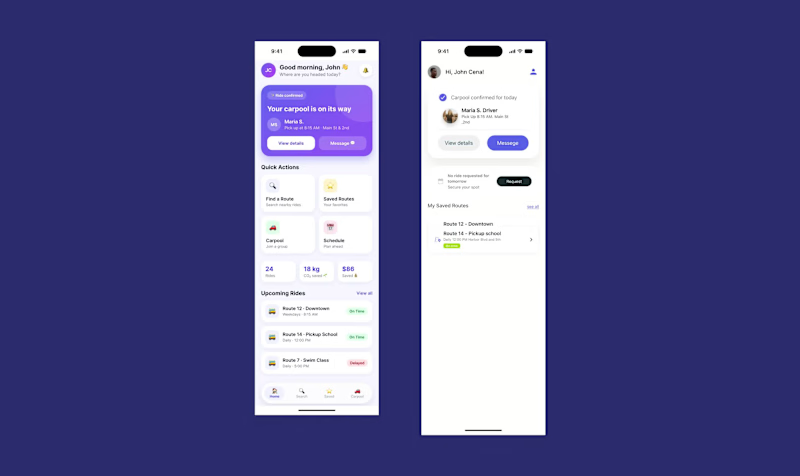
Ai gave me a purple gradient, a 👋, and a "Quick Actions" grid. Looks fine. Looks like every other app, too. Even the stats were made up ("18 kg CO₂ saved 🌱", sure, buddy).
My version looks plainer on purpose, because I kept catching things AI never would:
→ My nav and my home screen had the same 4 options. Looked complete, but made people choose twice.
→ A pre-filled "current location" sounds helpful until you remember nobody gave the app permission yet.
→ The "bus is late" screen. That's the moment someone is standing outside and stressed, so it matters more than the pretty one.
AI helped me a lot on this project. But it doesn't ride the bus, and it doesn't notice when a screen says "Welcome back to to Route Clear." That part is the job.
Swipe to see both versions 👉 Which one would you trust with your commute?
#UXDesign #ProductDesign #HumanCenteredDesign
1
176
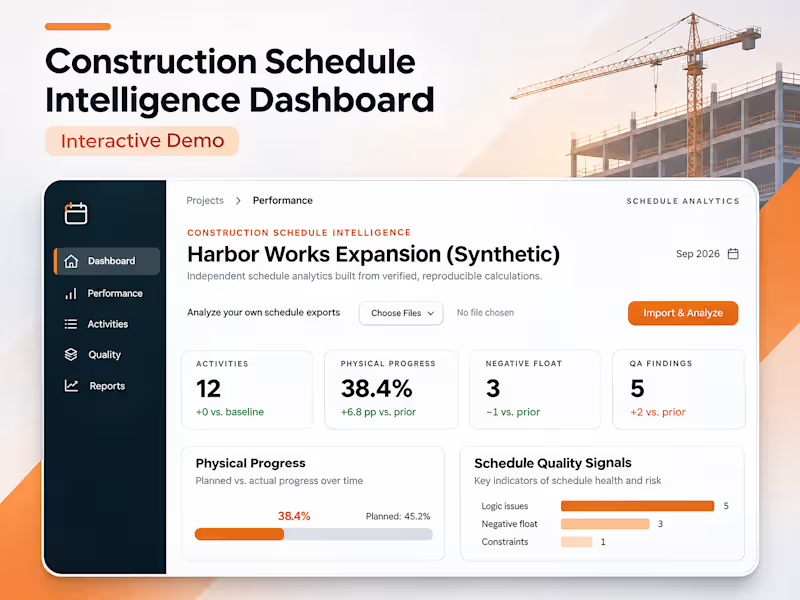
Construction Schedule Intelligence Dashboard | Interactive Demo
This video demonstrates an interactive, local-first construction schedule analytics dashboard designed to process Primavera P6 XER files, evaluate project performance, and identify scheduling risks.
Using the Harbor Works Expansion synthetic project, the walkthrough highlights how construction schedule data is transformed into measurable performance insights.
What the Video Demonstrates
Schedule Data Processing: An interactive dashboard populated with construction activity data and project scheduling information.
Project Health Metrics: 12 activities, 38.4% calculated physical progress, 3 negative-float activities, and 5 automated quality assurance findings.
Performance Visualization: Interactive progress tracking comparing 38.4% completion against a 33% baseline target.
Schedule Risk Detection: Identification of negative float and scheduling quality issues requiring attention.
Data Export: CSV and JSON export capabilities for sharing activity records and calculated results.
The demonstration showcases how automated schedule analysis can support faster project reviews, clearer performance reporting, and more informed project controls decisions.
0
13


VMA – Real Estate Property Management App
What it is:
A web application designed to help property managers track properties, tenants, and day-to-day management operations in one place.
What I built:
Property and unit management system
Tenant records and status tracking
Centralized dashboard for property data
Secure user access and role management
1
66


Increasing App Engagement by Simplifying Trip Planning and Ticketing for Metrolink Riders
Metrolink’s mobile app is a key way riders buy tickets—but many found it confusing, limited, and frustrating to use. Important tasks like choosing the right ticket, finding routes, and tracking trains weren’t clear or fully supported, leading to wasted time, mistakes, and lower app usage.
As the sole designer, I led a 3-month redesign focused on making the app more useful beyond just ticket purchasing. I clarified complex ticket information, simplified the buying process, and introduced key features like route recommendations, train tracking, and schedule checking—all designed to help users plan their trips with confidence.
After two rounds of user testing and iteration, user satisfaction significantly improved. The likelihood of users returning to the app increased by 37%, and overall experience ratings became more positive. This project demonstrated how clearer content, better structure, and the right feature set can turn a frustrating tool into one riders actually want to use.
0
54


