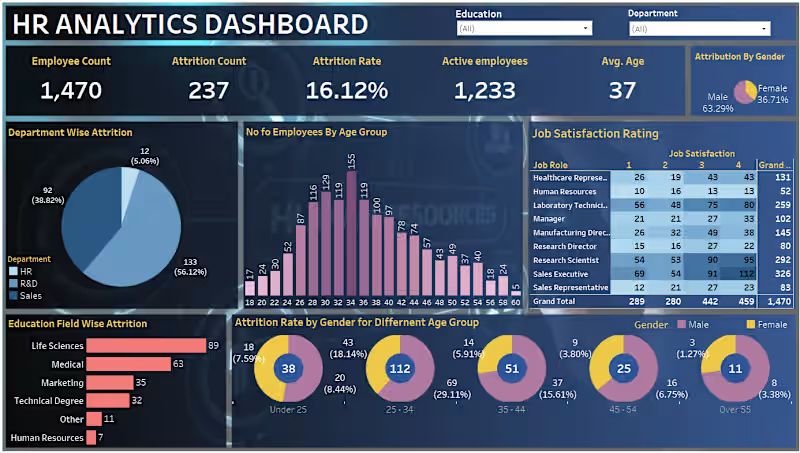
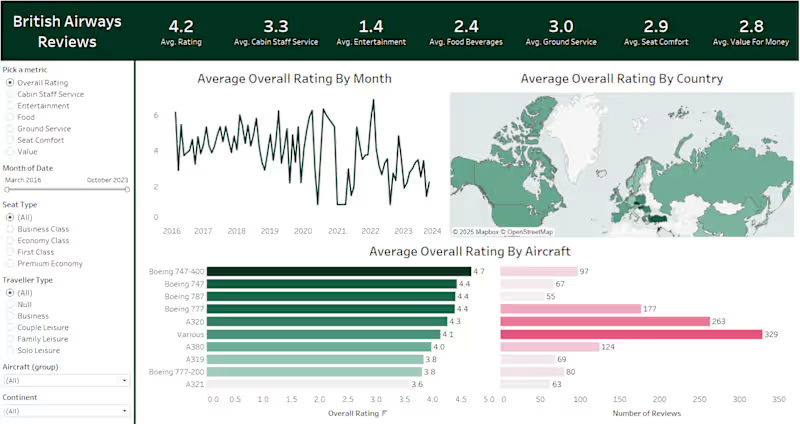
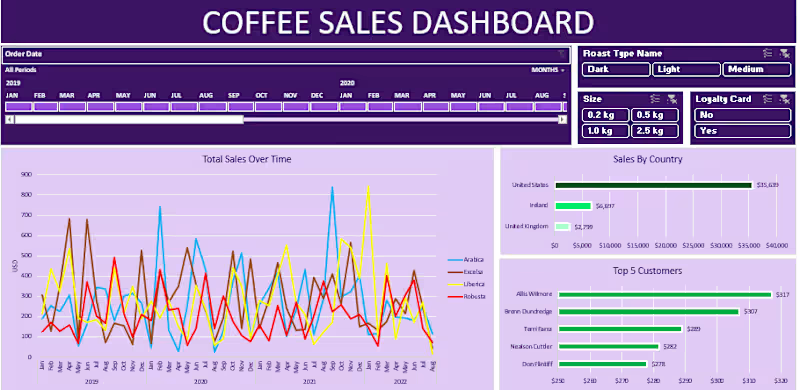
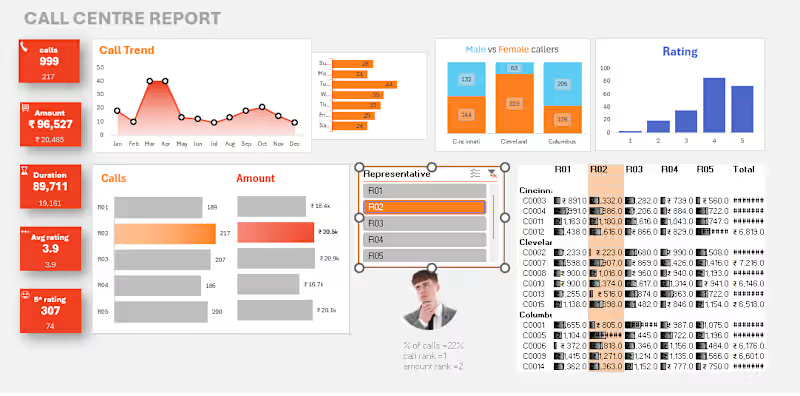
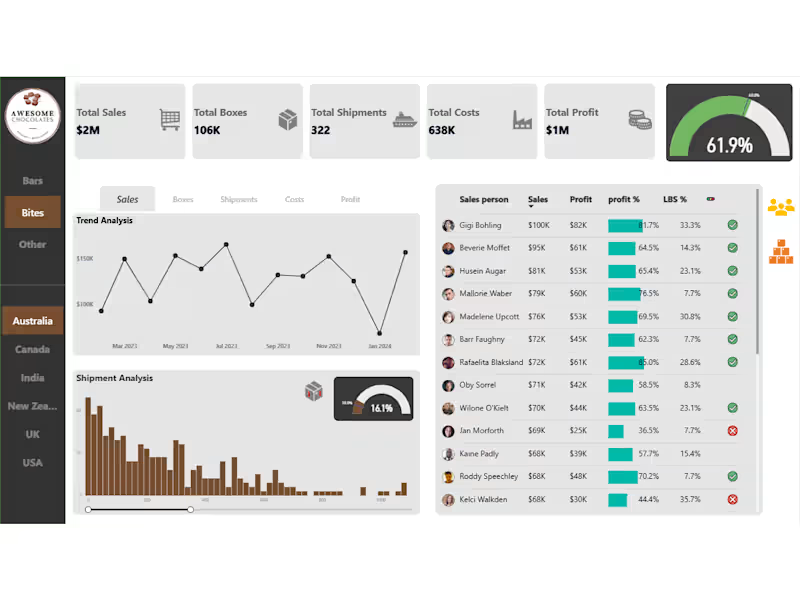
Projects using Microsoft Excel in ThoothukudiProjects using Microsoft Excel in ThoothukudiDeveloped an interactive HR Analytics Dashboard in Tableau to help organizations monitor workforce performance and employee trends. The dashboard provides insights into employee count, attrition rate, active employees, department-wise attrition, age distribution, education field analysis, job satisfaction ratings, and gender-based attrition. Interactive filters enable users to analyze data by department and education level, supporting data-driven HR decisions. This project demonstrates expertise in Tableau dashboard development, data visualization, KPI reporting, and business analytics. Created an interactive Tableau dashboard to analyze customer reviews and satisfaction for British Airways. The dashboard presents key performance metrics, including overall ratings, cabin staff service, entertainment, food, seat comfort, value for money, and ground service. It features interactive filters for traveller type, seat class, aircraft type, continent, and date range, along with trend analysis, geographic visualizations, and aircraft performance comparisons. This project showcases advanced Tableau visualization techniques and business intelligence reporting. Developed a dynamic Coffee Sales Dashboard in Microsoft Excel to analyze sales performance across products, countries, customer segments, and time periods. The dashboard features interactive slicers, sales trend analysis, top customer insights, country-wise sales comparisons, roast type analysis, loyalty card segmentation, and product size filters. Built using Pivot Tables, Pivot Charts, Slicers, Lookup Functions, and advanced Excel features, this project provides meaningful business insights through professional and interactive reporting. Designed and developed an interactive Call Centre Dashboard in Microsoft Excel to monitor key business metrics and agent performance. The dashboard provides insights into total calls, revenue generated, call duration, customer ratings, representative performance, call trends, regional performance, and customer satisfaction. Built using Pivot Tables, Pivot Charts, Slicers, Conditional Formatting, and advanced Excel functions, this dashboard enables users to filter data dynamically and make informed business decisions through clear and interactive visualizations. Designed and developed an interactive Power BI dashboard to analyze sales performance, revenue, profit, customer trends, and regional insights. The dashboard includes KPI cards, interactive filters, slicers, charts, and drill-down functionality to help businesses make data-driven decisions. The project involved data cleaning, transformation using Power Query, DAX calculations, and professional dashboard design.