The network for creativity
Join 1.25M professional creatives like you
Connect with clients, get discovered, and run your business 100% commission-free
Creatives on Contra have earned over $150M and we are just getting started
Back to feedPost

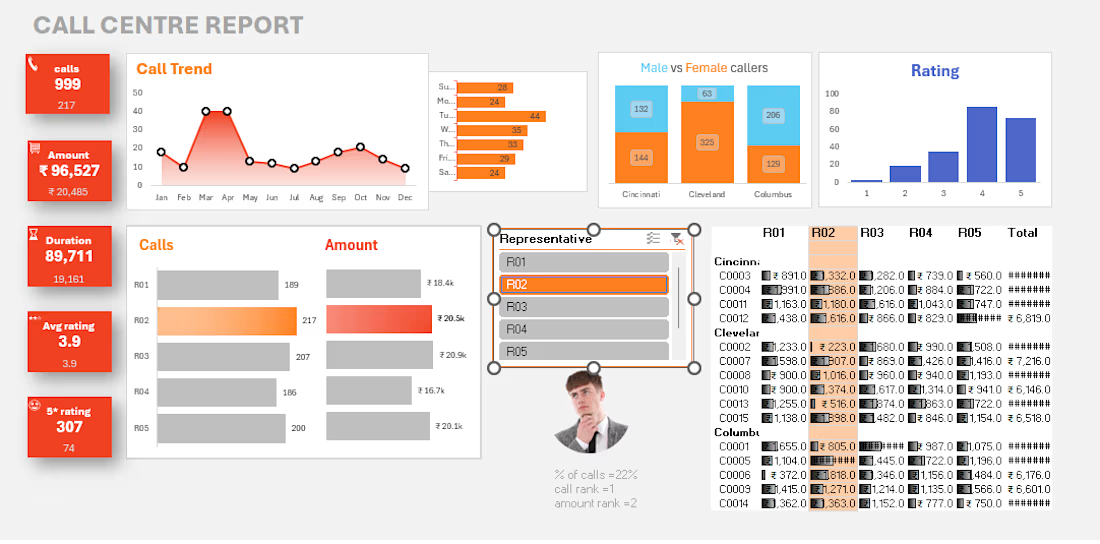
Designed and developed an interactive Call Centre Dashboard in Microsoft Excel to monitor key business metrics and agent performance. The dashboard provides insights into total calls, revenue generated, call duration, customer ratings, representative performance, call trends, regional performance, and customer satisfaction. Built using Pivot Tables, Pivot Charts, Slicers, Conditional Formatting, and advanced Excel functions, this dashboard enables users to filter data dynamically and make informed business decisions through clear and interactive visualizations.

The network for creativity
Join 1.25M professional creatives like you
Connect with clients, get discovered, and run your business 100% commission-free
Creatives on Contra have earned over $150M and we are just getting started





Related posts

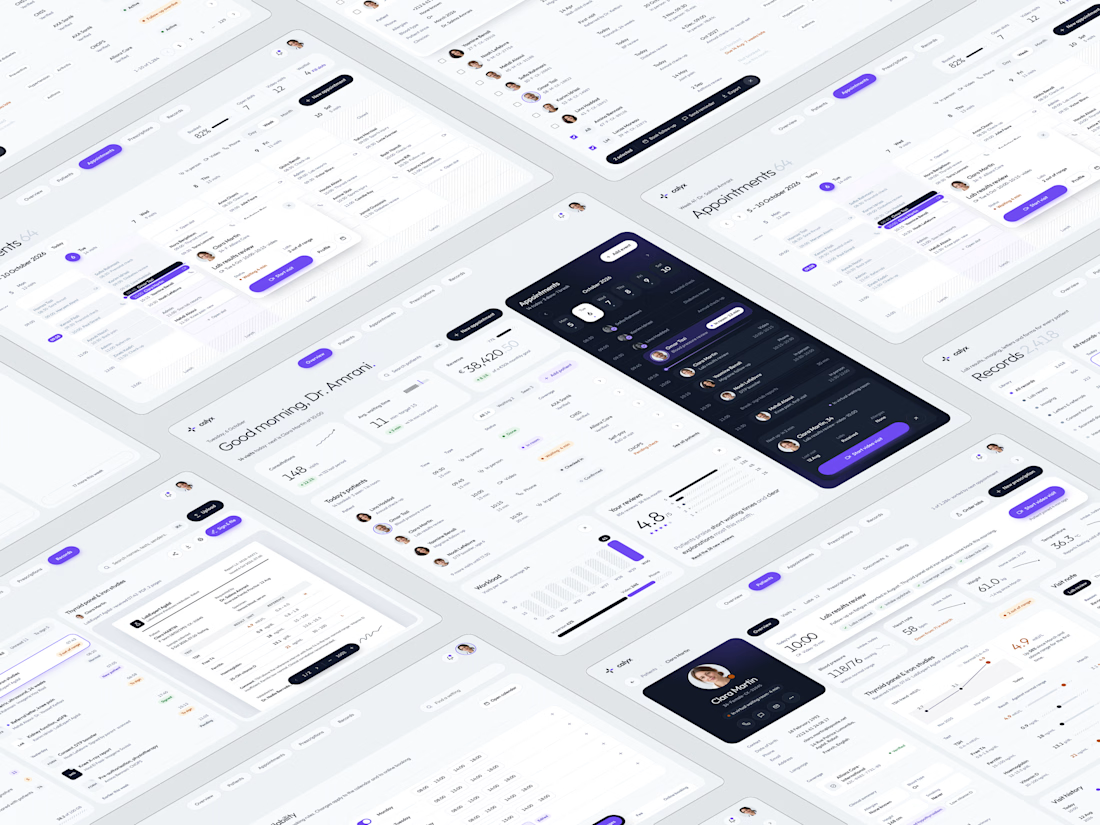
Working on Calyx, a dashboard for private medical practices. Honing my design workflow is what I have been doing those last weeks, with Claude assistance being absolutely ridiculous in helping me ship deliverables.



Love the vibe of this!

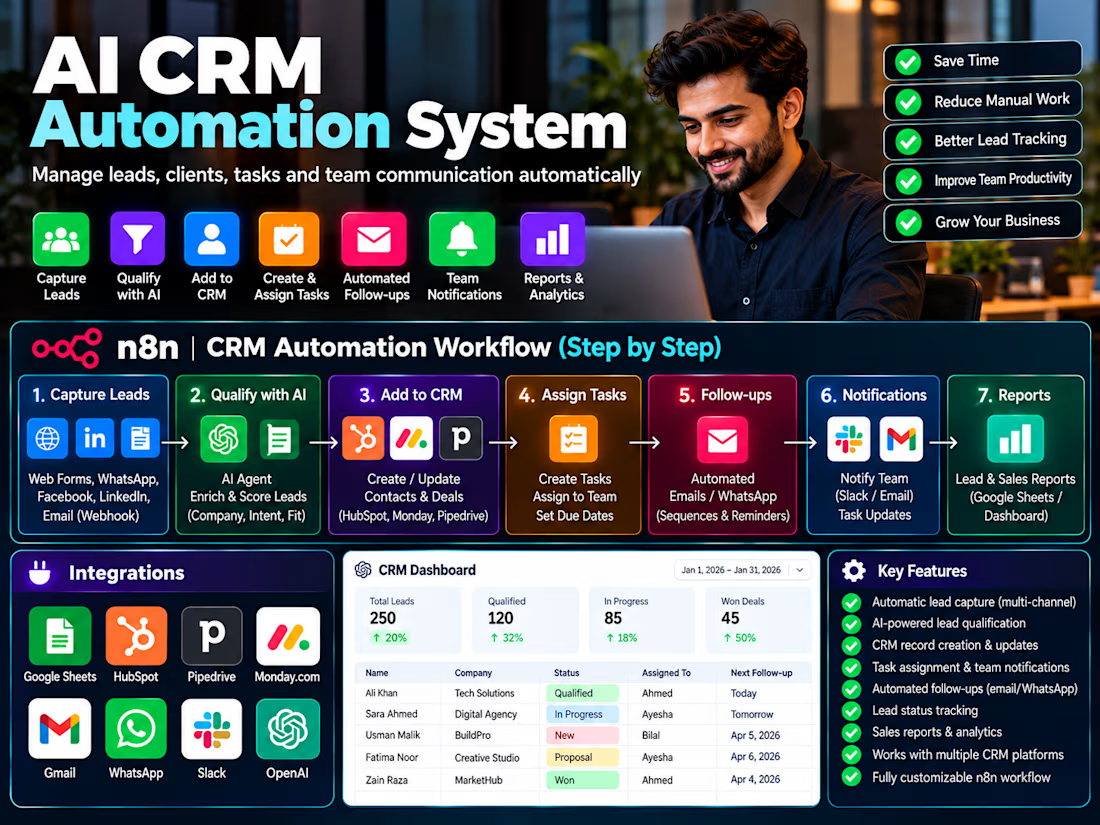
Built an n8n CRM automation system that captures leads, creates and updates CRM records, assigns tasks, sends team notifications, automates follow-ups and generates reports.


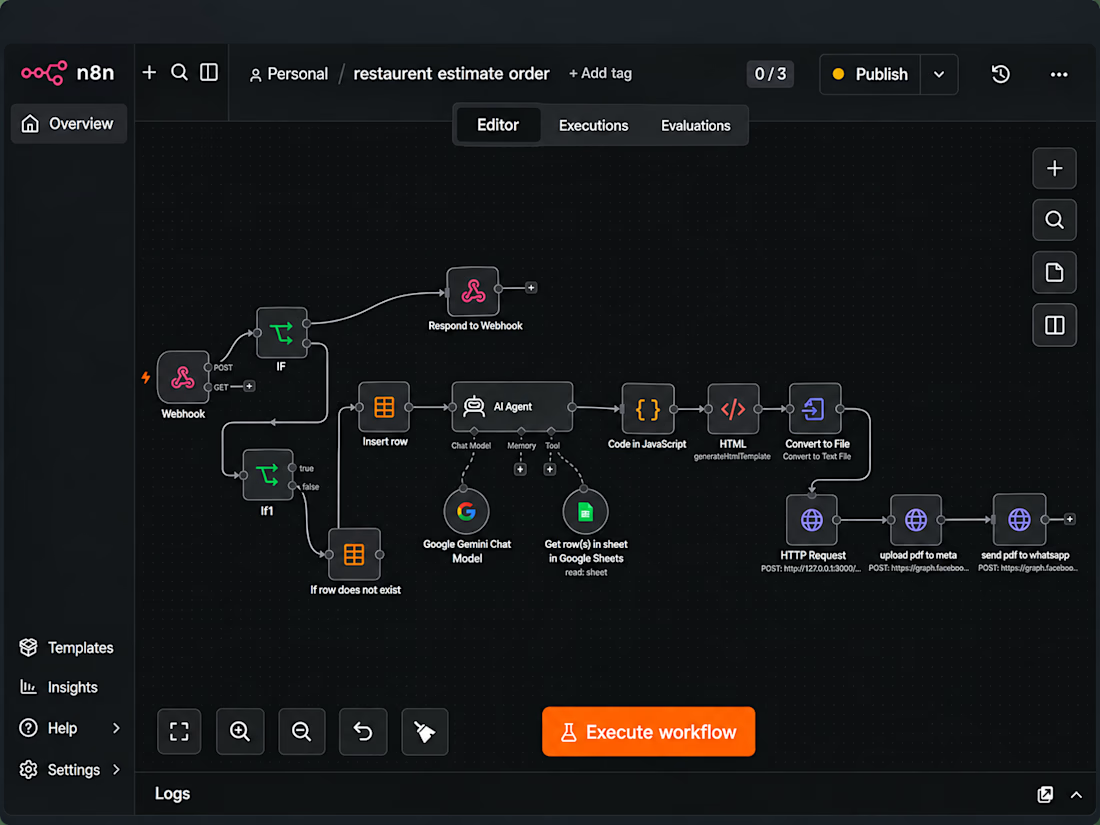
Restaurant Automation System. Automates WhatsApp orders, menu & pricing lookup, estimate generation, PDF invoices, and order processing using n8n, Google Sheets, Gemini AI and WhatsApp Cloud API.