The network for creativity
Join 1.25M professional creatives like you
Connect with clients, get discovered, and run your business 100% commission-free
Creatives on Contra have earned over $150M and we are just getting started
Back to feedPost

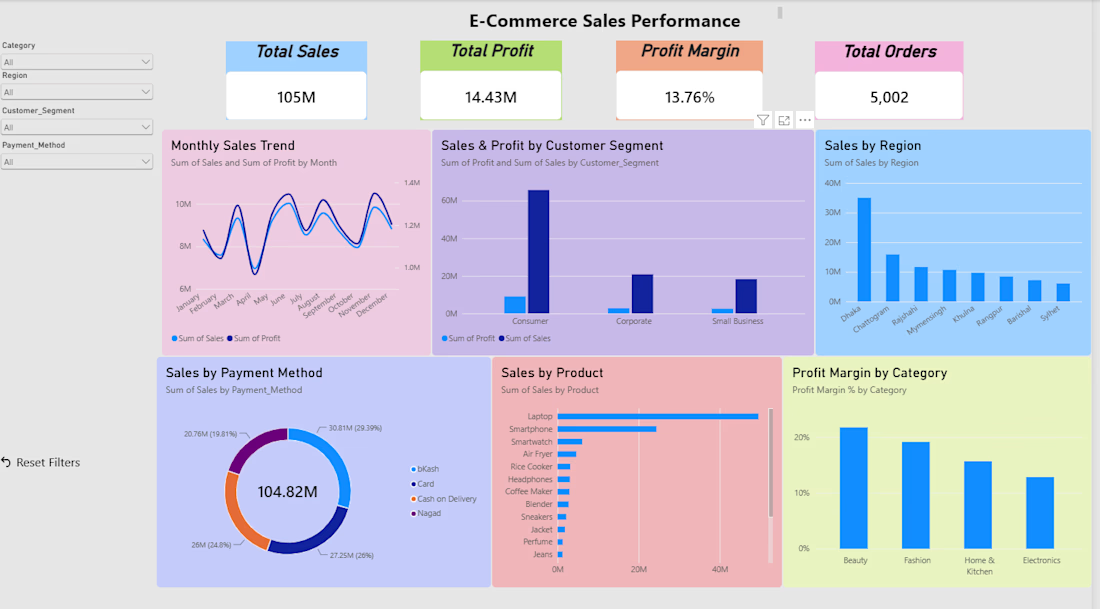
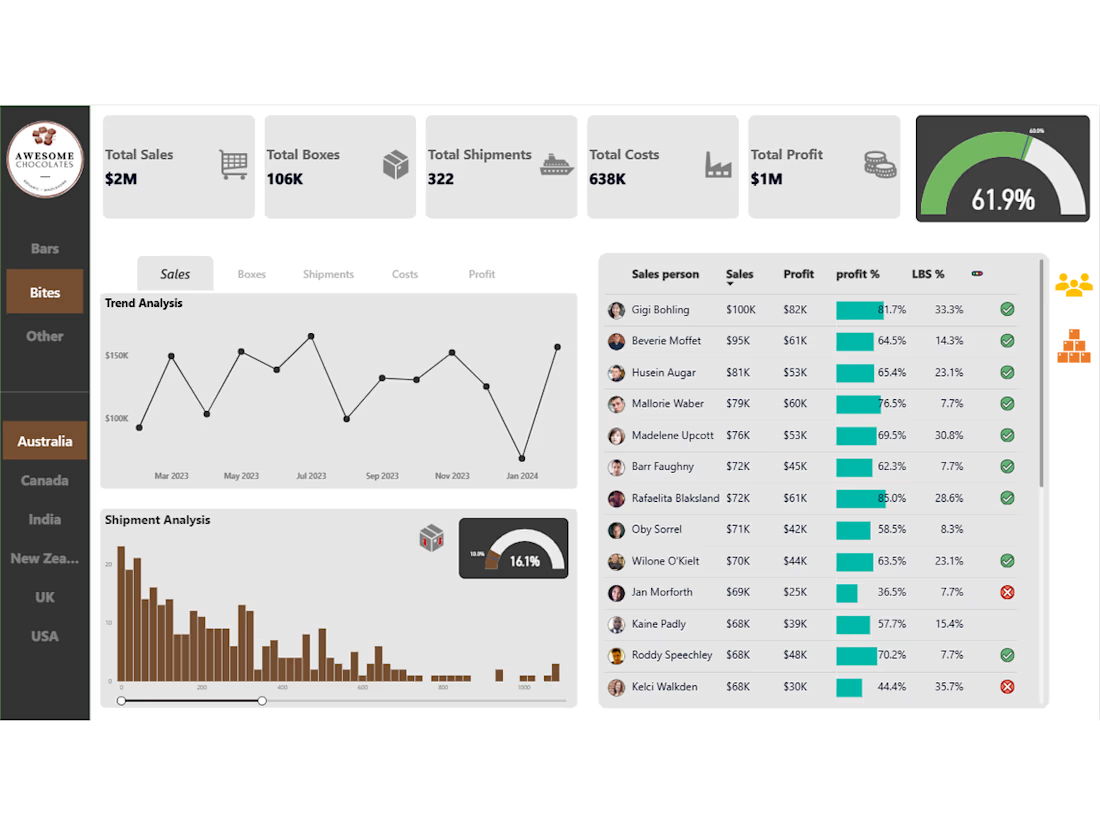
Designed and developed an interactive Power BI dashboard to analyze sales performance, revenue, profit, customer trends, and regional insights. The dashboard includes KPI cards, interactive filters, slicers, charts, and drill-down functionality to help businesses make data-driven decisions. The project involved data cleaning, transformation using Power Query, DAX calculations, and professional dashboard design.


The network for creativity
Join 1.25M professional creatives like you
Connect with clients, get discovered, and run your business 100% commission-free
Creatives on Contra have earned over $150M and we are just getting started





Related posts

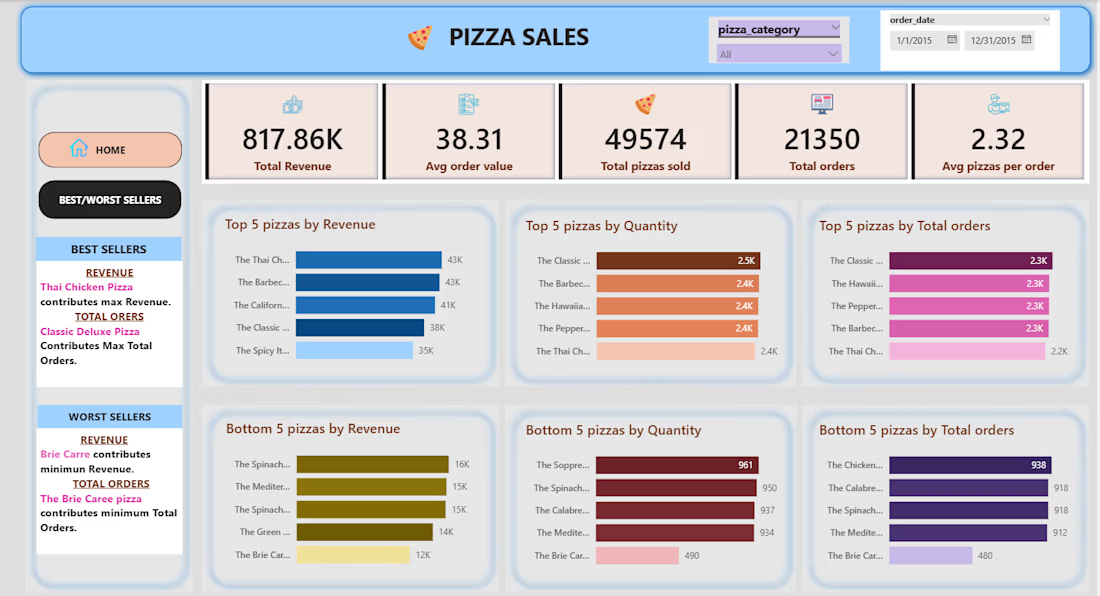
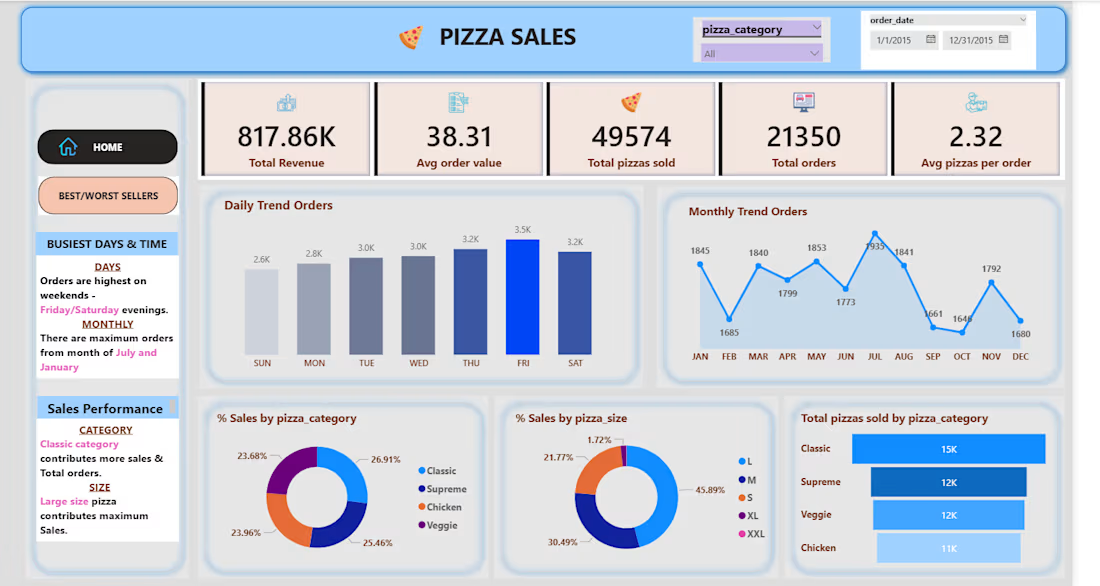
I created Dashboard for Pizza sales, to determine total orders placed, Revenue generated by pizza category, what kind of Pizza contributing more to the Revenue, percentage of sales by pizza category, sales by pizza size, best and worst performers by involving KPI's, graphs, DAX Functions, Power Query Editor and other features of Power BI.


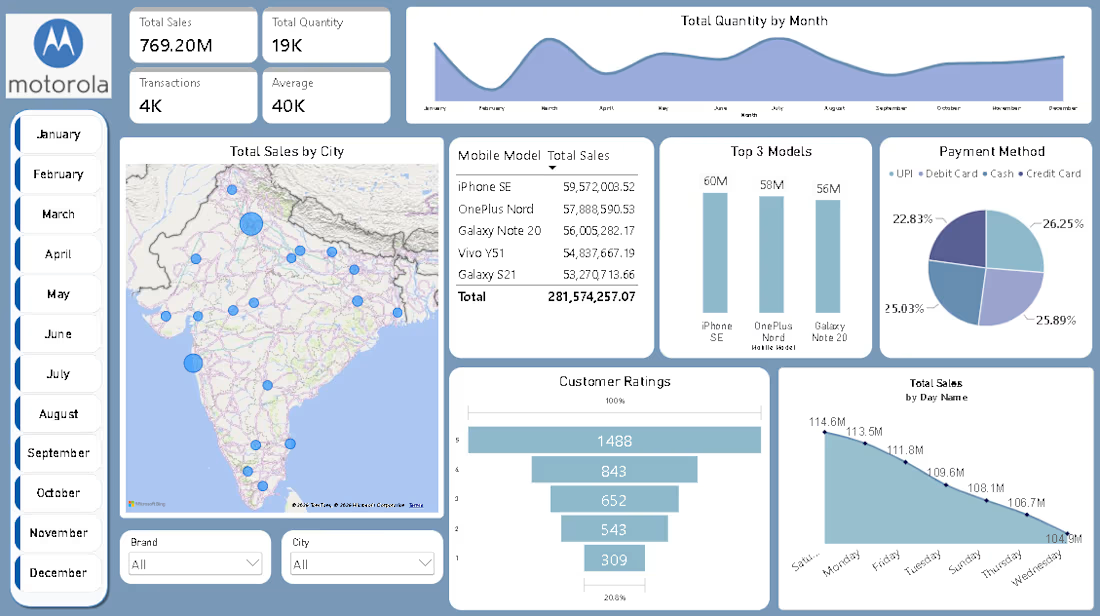
$769M Motorola Sales - India Regional Dashboard
CLIENT PROBLEM: No city-wise visibility, which mobile model sells where.
WHAT I BUILT:
✓ $769.20M Total Sales + 19K Quantity tracking
✓ India map with Total Sales by City (Mumbai, Delhi, Bangalore)
✓ Top 3 Models: iPhone SE, OnePlus Nord, Galaxy Note 20
✓ Payment Method split: UPI, Debit, Cash, Credit
✓ Customer Ratings funnel (1488 to 309)
✓ Monthly slicer (Jan-Dec) + Day-wise sales trend
✓ Brand & City filters
TOOLS: Power BI, DAX, Maps, India market data
RESULT: Sales manager can see which city buys which model and best day to run offers.
DM for live demo of interactive map.

E-Commerce Sales & Profit Analysis | Power BI Dashboard
Project Description
An end-to-end e-commerce analytics project focused on understanding sales performance, profitability, customer behavior, and regional trends.
I analyzed 5,000+ orders to identify key business trends and performance drivers.
Key Areas Analyzed:
📈 Total Sales & Profit
📅 Monthly Sales Trends
👥 Customer Segment Performance
🌍 Regional Sales Analysis
📦 Product Performance
💰 Profit Margin by Category
💳 Payment Method Analysis
What I did:
• Cleaned and prepared the dataset using Excel
• Performed SQL-based analysis using PostgreSQL
• Built an interactive Power BI dashboard
• Created KPIs and visualizations to track business performance
• Analyzed sales, profit, customers, products, and regional performance
• Generated business insights from the analyzed data
Tools:
Excel • PostgreSQL • SQL • Power BI
Workflow:
Raw Data → Excel → PostgreSQL → SQL Analysis → Power BI → Business Insights
Outcome:
The dashboard provides a clear view of e-commerce performance and helps identify sales trends, profitable categories, customer segments, and areas for business improvement.