Projects using pandas in Pune
Projects using pandas in Pune
Sign Up
Post a job
Sign Up
Log In
Filters
2
Projects
People
Message
1
Umar Shaikh
main_palmer_penguin_EDA_2024-project
1
14
Message
1
Sarbjot Singh
Data Analytics Project | BlinkIT Grocery Sales Analysis Excited to share my latest Data Analytics project ,where I analyzed BlinkIT Grocery Sales Data and delivery data to uncover meaningful business insights 📈 📊 What I worked on: Analyzed sales performance across product categories, outlet types, sizes, and locations Identified top-performing item categories and customer preferences Studied the impact of outlet size, establishment year, and visibility on sales Converted raw data into actionable insights and business recommendations 💡 Key Insights: Fruits & Vegetables, Snack Foods, and Frozen Foods drive maximum sales FOR FULL PROJECT VIST GIT HUB –( https://lnkd.in/d34sdAPz )
1
56
Message
0
Daniyal Shaikh
Online Retail Price Analysis - Flipkart vs Amazon
0
2
Message
0
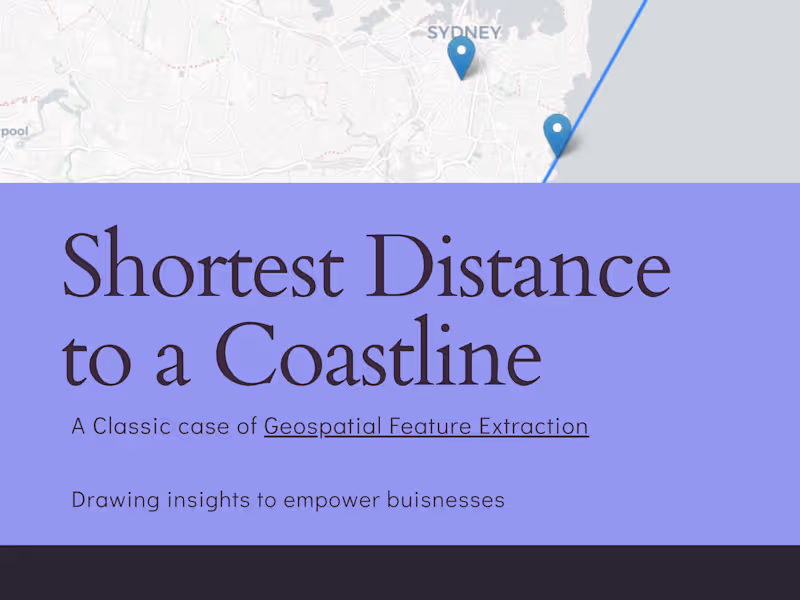
Kaustubh Bhiwsankar
Geospatial Analysis and Feature Extraction 📊🌏
0
14
Message
0
JAYESH NIKAM
CargoOptix: Automated Ship Load Balancing System
0
1
Message
0
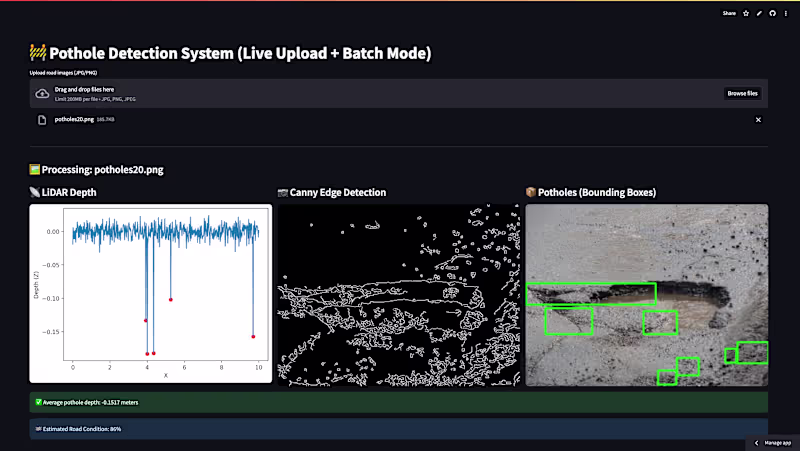
Krishnansh Vasaniya
Simulated Pothole Detection System
0
1
Message
1
Umar Shaikh
main_palmer_penguin_EDA_2024-project
1
9
Message
2
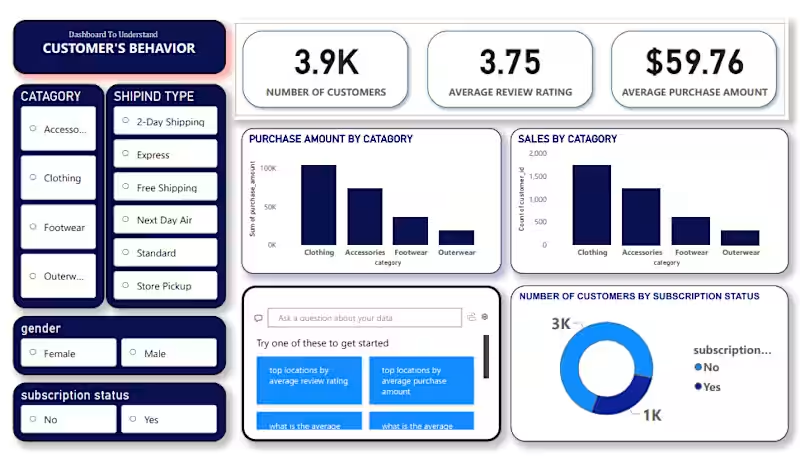
Sarbjot Singh
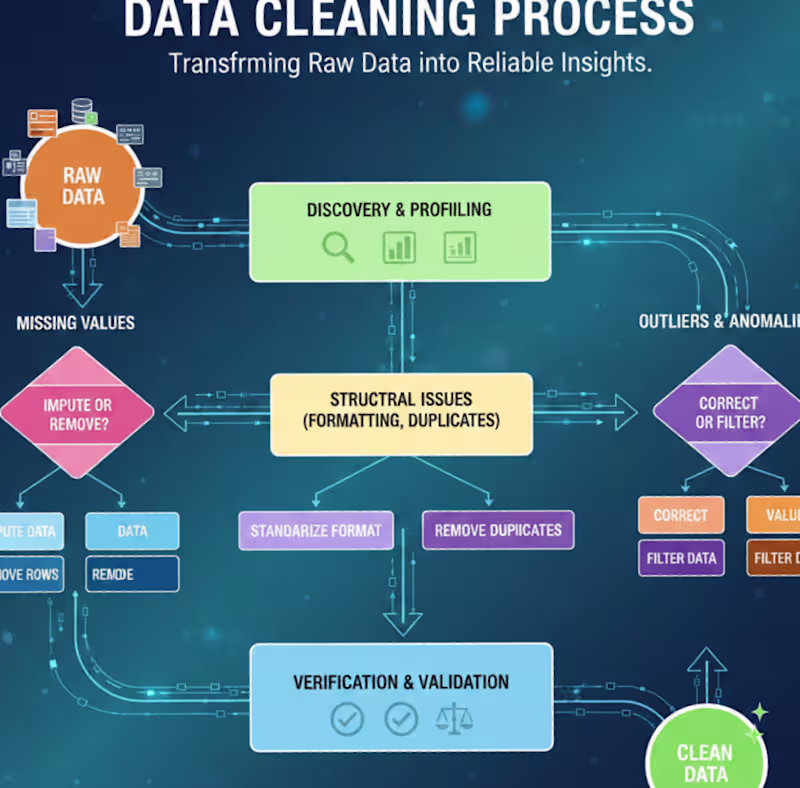
I’m excited to share my latest Data Analytics project where I analyzed Customer Shopping Behavior to uncover trends in sales, demographics, and purchasing habits.This project was a great exercise in building a complete data pipeline. The Tech Stack: Python (Pandas & NumPy): Used in Jupyter Notebooks for initial data exploration and statistical analysis. PostgreSQL: Utilized for rigorous data cleaning, querying, and structuring the dataset for analysis. Power BI: Built an interactive dashboard to visualize key metrics like seasonal trends, subscription impacts, and category performance. Project Highlights: ✅ Data Cleaning: Leveraged PostgreSQL and Pandas to handle missing values and standardize categorical data.
1
2
83
Message
0
Daniyal Shaikh
Flipkart Laptop Web Scraping Project
0
3
Message
0
Kaustubh Bhiwsankar
Dynamic Media Scraping Solution 🎭
0
7
Message
0
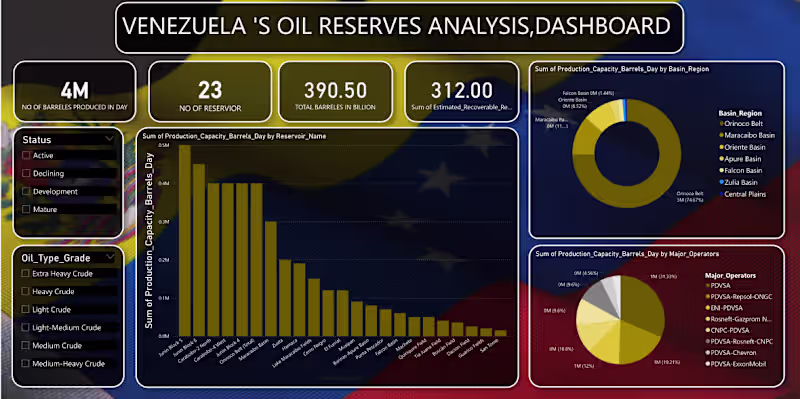
Sarbjot Singh
Venezuela’s Oil Reserves Analysis Dashboard 📊 I am excited to share my latest data analytics project focusing on the energy sector. Using a dataset covering 23 reservoirs, I designed a comprehensive dashboard to track production capacity and resource distribution in Venezuela. Key Features: ✅ Real-time Metrics: Tracking the 390.50 Billion total barrels in reserve. ✅ Granular Analysis: Production capacity breakdown by reservoir name and oil grade (Extra Heavy to Light). ✅ Stakeholder Mapping: Visualizing the production sum by major operators. Tools Used: [pandas(jupyter notebook)/mysql(for analysis and cleaning of data), Power BI / Excel(for building dashboard)] I’d love to hear your thoughts or feedback on the dashboard design! must visit my github for full project -( https://lnkd.in/dYKdZ8J2 )
0
59
Message
0
Kaustubh Bhiwsankar
End-to-End Data Analytics 📊💻🔍
0
11
Explore projects