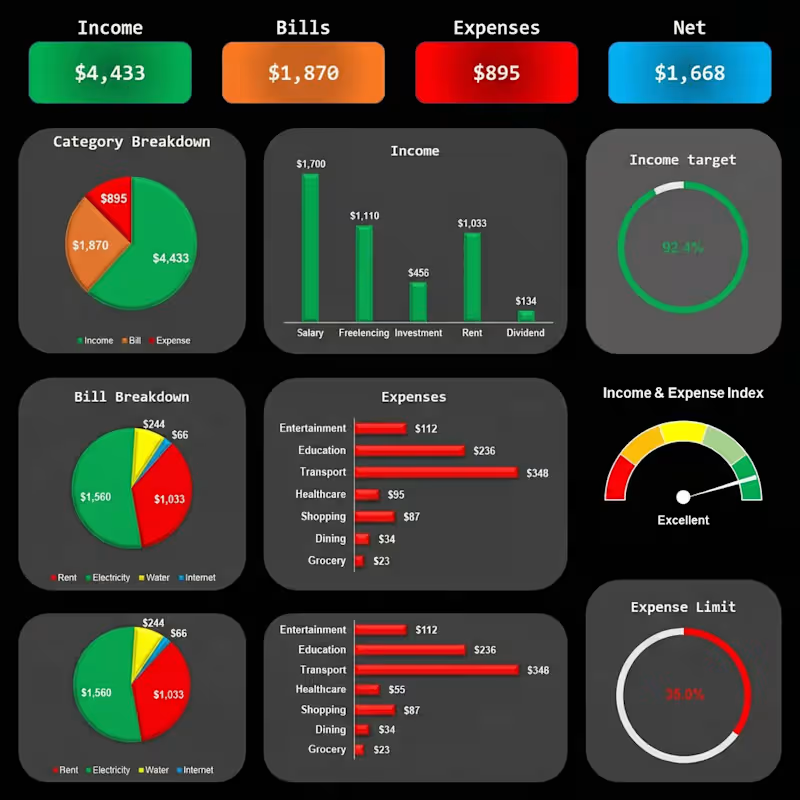
I built this dashboard to transform complex wholesale sales data into actionable intelligence.
This is exactly what it tracks:
→ Executive Snapshot: Key performance indicators (Sales, Orders, Quantity) at the top.
→ Payment Status: A real-time breakdown of outstanding, overdue, paid, and partially paid statuses to monitor cash flow.
→ Salesman Performance: A clean leaderboard to identify top contributors instantly.
→ Trend & Regional Analysis: Monthly sales velocity combined with a regional breakdown to see where the business is doing great.
The raw data behind this was massive, but looking at it would only feel it's chaos.
This dashboard turns it into a 10 second task of understanding everything.
That is the whole point not just to make something look professional, but to make it functional.
P.S. If your business is still reading raw spreadsheet data to make decisions, I would love to show you what a custom dashboard could look like for your specific numbers.
1
2
108
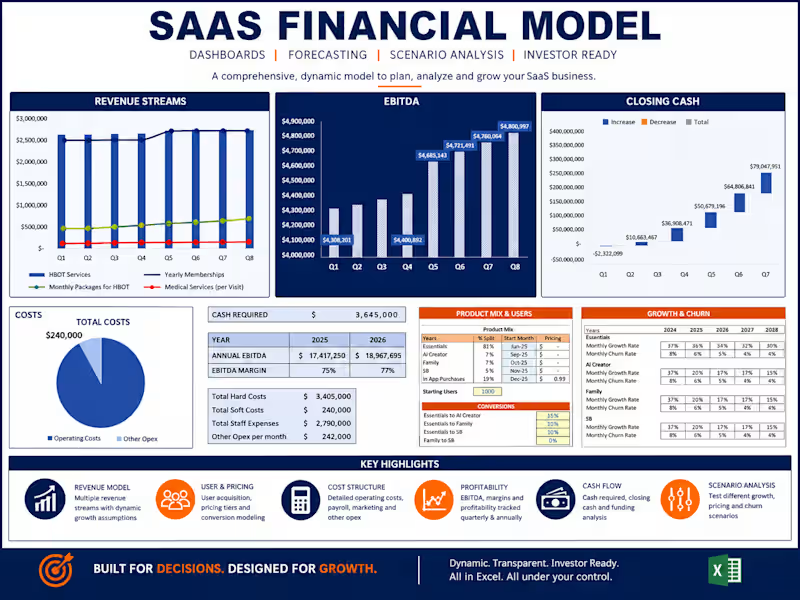
Building a SaaS financial model that goes beyond a basic revenue forecast.
This model brings the key drivers of a subscription business into one integrated framework:
Revenue & product mix
User acquisition, growth & churn
Pricing & conversion assumptions
Operating costs & headcount
EBITDA & profitability
Cash flow & funding requirements
Scenario & sensitivity analysis
Management dashboard & KPIs
The objective is simple: turn business assumptions into a clear financial picture that supports better decisions.
I build dynamic financial models for startups, SaaS businesses, investors, founders, and management teams—from early-stage planning to investment and growth analysis.
Financial Modeling | FP&A | Forecasting | Valuation | Investment Analysis | Financial Automation
#FinancialModeling #SaaS #FP&A #FinancialAnalysis #FinancialForecasting #Excel #FinancialAutomation #Startups
0
47