Projects using Looker in Pakistan
Projects using Looker in Pakistan
Sign Up
Post a job
Sign Up
Log In
Filters
2
Projects
People
Message
1
Tayyab Ali
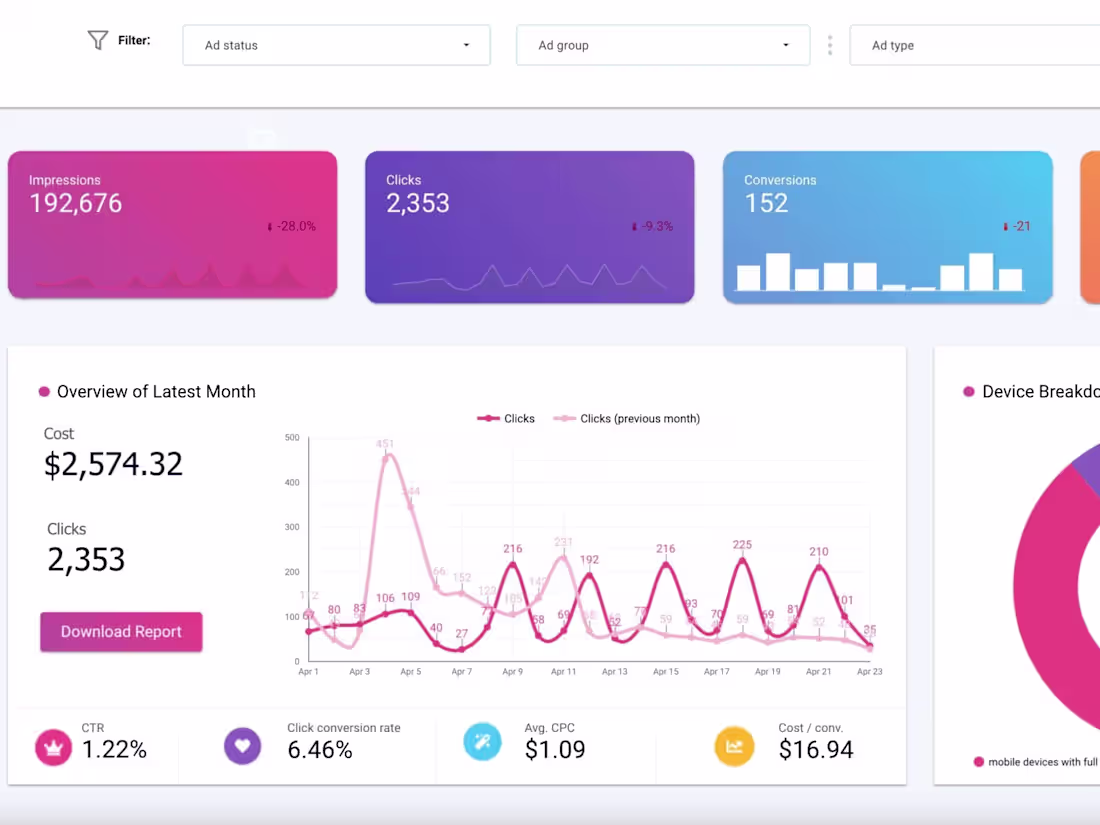
BI Dashboard | Google Analytics | Google Data Studio
1
113
Message
0
Umar Aurangzeb
I recently engineered a real-time tracking system for a school to replace static reports with continuous feedback. Using a Google Sheets-to-Looker Studio pipeline, I automated the transition from raw teacher observations to parent-facing insights. Key Deliverables: Live Pipeline: Structured Sheets input for teachers to log 12+ data points per student daily. Grit Scoring Engine: Built custom logic weighting effort over mastery using cohort benchmarks. Dynamic URL Security: Implemented unique, filtered dashboard links for secure parent/student access. Automated Insights: Built-in trend indicators (Improving/Stable/Declining) for instant intervention. The Impact: The client now uses a live command center that eliminates manual reporting and provides real-time actionable intelligence.
0
155
Message
0
Ahmad Hussain
Google Looker Studio
0
24
Message
0
Shoaib Sajid
Dashboard in Looker Studio
0
2
Message
1
Imaad Mahmood
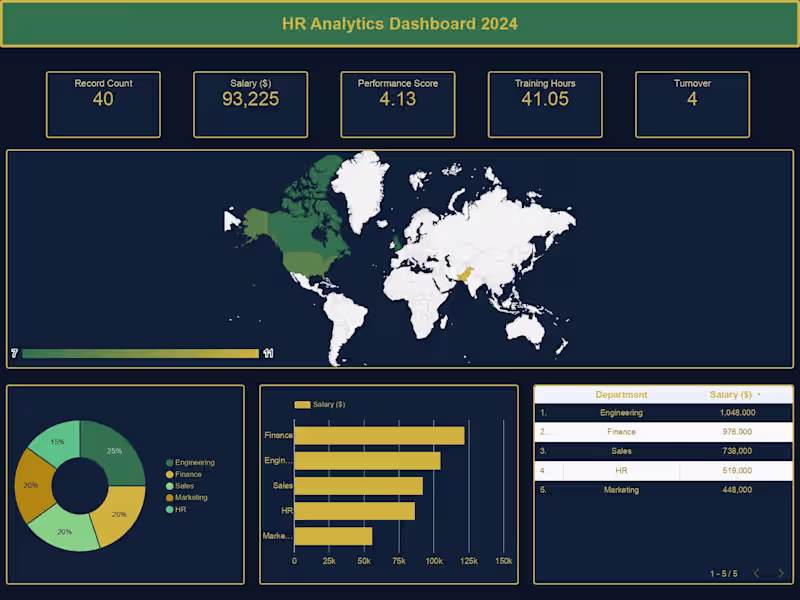
HR teams spend hours every week pulling salary, performance, and turnover data from separate spreadsheets. This dashboard puts all of it in one place — live. Built this HR Analytics Dashboard in Google Looker Studio with 5 KPI cards, department salary breakdown, geo distribution map, and a ranked leaderboard sorted by total compensation. Engineering leads at $1.05M total salary. Finance close behind. Decision-makers can see that in 3 seconds instead of 3 hours.
1
151
Message
0
Muhammad Hassan Ali
Design and Data Architecture
0
17
Message
0
Jahanzeb Khan
Creating Interactive Data Dashboards with Google Data/Looker
0
23
Message
3
Imaad Mahmood
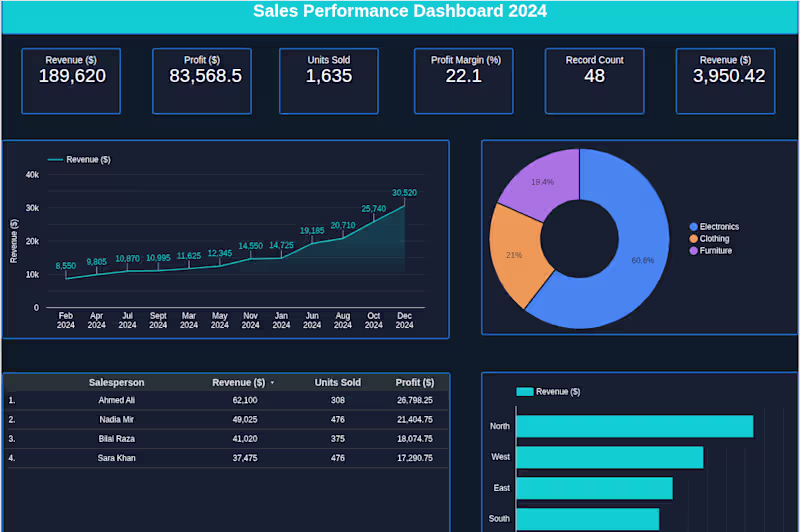
Built an interactive Sales Performance Dashboard in Google Looker Studio — fully connected to live data. Features 6 KPI cards (Revenue, Profit, Units Sold, Margin, Orders, Avg Order Value), revenue trend line chart, category donut chart, region breakdown, and salesperson leaderboard.
2
3
257
Message
0
Muhammad Hassan Ali
Data Centralization
0
16
Explore projects