Freelance Videographers in NairobiFreelance Videographers in Nairobi
Innovative Web Designer, Graphic Designer, UI/UX
5.0
Rating
13
Followers
Innovative Web Designer, Graphic Designer, UI/UX
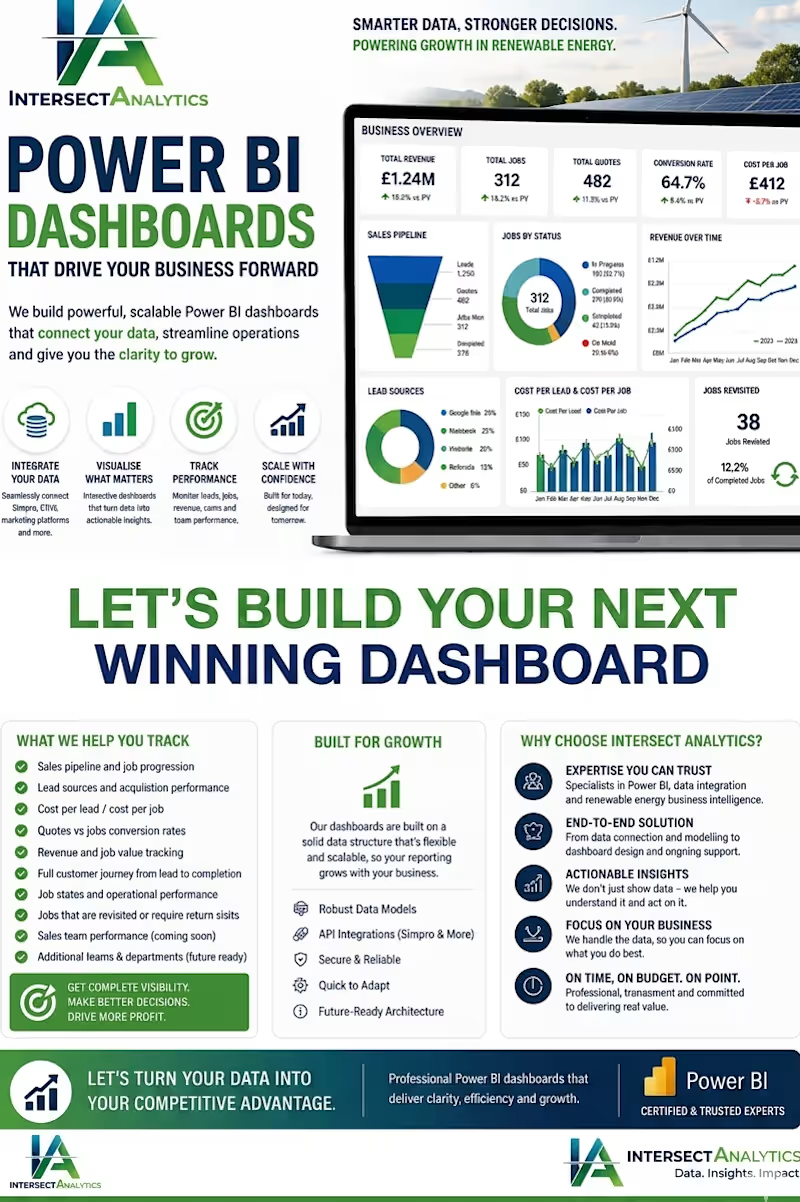
Delivering Strategic Growth Through Data, Finance & Tech.
7
Followers
Delivering Strategic Growth Through Data, Finance & Tech.
Cover image for Alphabet Performance Analysis: What Business
Alphabet Performance Analysis: What Business Leaders Can Learn From One of the World’s Most Successful Companies Prepared by Intersect Analytics | Business Intelligence, Financial Analysis & Automation Prepared by Intersect Analytics At Intersect Analytics, we analyzed Alphabet Inc.’s financial and operational performance using Python for data extraction and transformation and Power BI for dashboard development to understand how business segments contribute to growth, profitability, and long-term performance. Key Findings Google Search Remains the Core Revenue Driver Google Search & Other continues contributing the largest share of Alphabet’s revenue, maintaining its leadership in digital advertising and search services. Google Cloud Continues Strong Growth Google Cloud remains one of Alphabet’s fastest-growing business segments, supported by increased enterprise demand, AI adoption, and cloud infrastructure expansion. YouTube Strengthens Revenue Performance YouTube continues generating strong advertising revenue, reinforcing Alphabet’s ability to monetize digital engagement at scale. Profitability Remains Strong Despite major investments in AI, cloud infrastructure, and innovation, Alphabet continues maintaining strong operational performance and financial resilience. Diversified Revenue Supports Stability Alphabet benefits from multiple business segments across Search, Cloud, YouTube, Devices, and Emerging Ventures, strengthening resilience and reducing dependency on a single revenue source. Recommendations ✔ Improve performance visibility through real-time dashboards and KPI tracking. ✔ Invest strategically in high-performing business segments. ✔ Use automation and analytics to improve reporting speed and decision-making. ✔ Strengthen operational monitoring to identify inefficiencies early. How Intersect Analytics Helps Businesses We help organizations transform manual reporting into intelligent business systems through: 📊 Power BI Dashboards & Business Intelligence 📈 Financial Analysis & Performance Reporting 🐍 Python Data Scraping & Automation ⚙️ Excel & Google Sheets Automation 🔄 Business Process Automation 📉 Data Analytics & Strategic Insights Why Choose Intersect Analytics ✅ Business-focused solutions ✅ Executive-quality dashboards ✅ Automation-driven reporting ✅ Scalable analytics systems Because growth is driven by better visibility, faster decisions, and intelligent execution. INTERSECT ANALYTICS Decisions Backed by Data. Growth Driven by Insight. 📞 +254 723 632 207
1
11
Cover image for Africa’s corporate growth story is
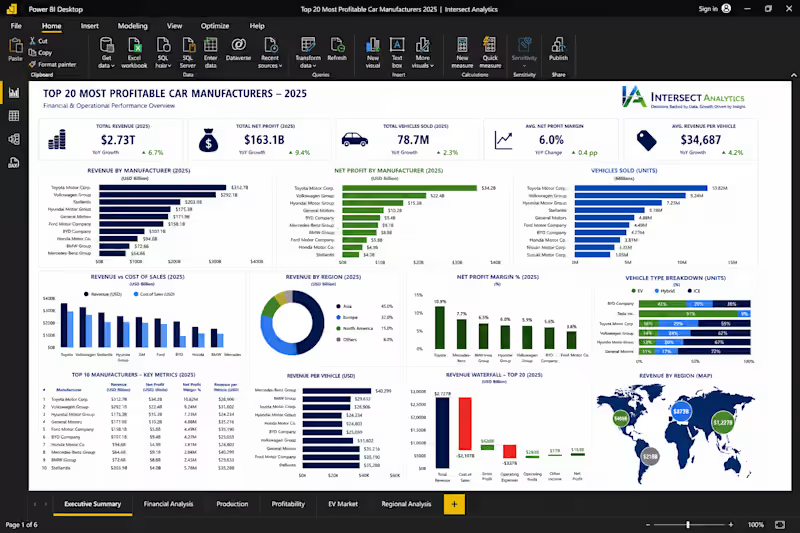
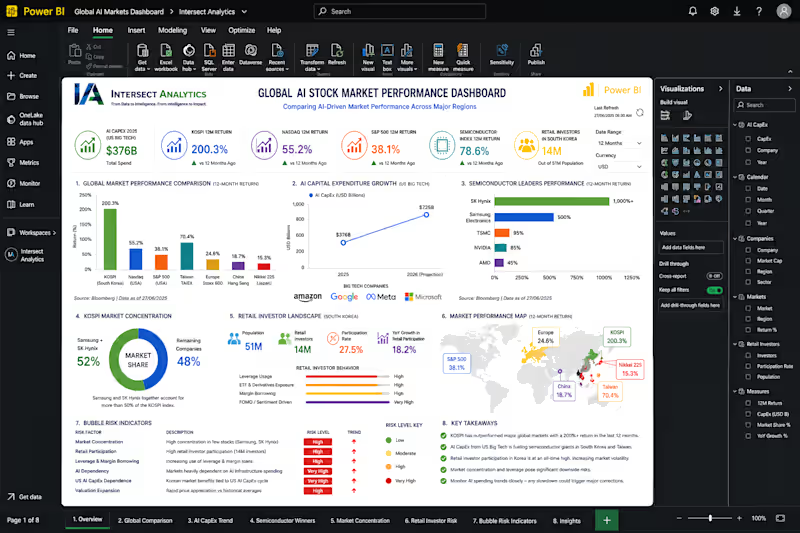
Africa’s corporate growth story is being shaped by a few powerful giants. But what truly drives performance across industries? At Intersect Analytics, we wanted to answer that question. So we scraped, structured, transformed, and analyzed real-world corporate data using Python, then developed an executive-level Power BI dashboard to uncover the performance drivers behind some of Africa’s most influential companies across: 🏦 Banking & Finance 📡 Telecoms & Technology 🛒 Retail & Consumer Goods 🛢️ Energy, Mining & Industry ✈️ Aviation What did we uncover? 📈 Banking & Telecoms continue to dominate revenue generation Large financial institutions and telecom operators remain the backbone of Africa’s corporate economy, driven by scale, customer reach, and digital expansion. 🌍 Geographic presence matters Organizations operating across multiple countries demonstrate stronger resilience, diversified revenue streams, and greater long-term scalability. 📱 Technology-enabled businesses outperform Companies leveraging digital ecosystems, mobile platforms, and customer connectivity continue creating stronger operational efficiencies and customer growth. ⚙️ Operational scale is a competitive advantage Whether measured through customer base, branch networks, stores, subscribers, or infrastructure, scale continues separating market leaders from followers. 📊 Executive visibility drives better decisions Complex business environments require more than spreadsheets. Leaders need real-time visibility into revenue, profitability, operations, geographic performance, and growth trends. How we built it Using Python, we scraped and consolidated multi-source corporate data, cleaned and transformed datasets, standardized financial and operational KPIs, and prepared a robust analytics model. Using Power BI, we transformed complexity into an interactive executive dashboard designed for decision-makers. The result? A dashboard that answers: ✔️ What drives growth? ✔️ Which sectors outperform? ✔️ Where are risks and opportunities emerging? ✔️ What operational metrics matter most? What we do at Intersect Analytics We help organizations turn fragmented business information into decision-ready intelligence through: 📊 Power BI Executive Dashboards 🐍 Python Data Scraping & Automation ⚙️ Excel & Google Sheets Automation 📈 Financial Analysis & Forecasting 🗄️ Business Intelligence & KPI Reporting Because growth becomes easier when leaders can see clearly. DECISIONS BACKED BY DATA. GROWTH DRIVEN BY INSIGHT. 📱 WhatsApp: +254 723 632 207 #PowerBI #Python #BusinessIntelligence #DataAnalytics #ExecutiveDashboard #Automation #DigitalTransformation #BusinessGrowth
1
2
108
Cover image for Executive Summary — Kenya Banking
Executive Summary — Kenya Banking Sector Dashboard At Intersect Analytics, we analyzed Kenya’s top-performing banks to uncover trends in profitability, growth, customer expansion, lending, and operational performance. Using Power BI and advanced financial analytics, we transformed complex banking data into an executive dashboard that supports faster, smarter, and data-driven decision-making. Key Insights 1. Market Leadership Remains Concentrated KCB Group and Equity Group continue leading in assets, customer base, loan book, and revenue, reinforcing their dominance in Kenya’s banking sector. 2. Profitability Is Not Driven by Size Alone Banks such as Co-operative Bank and NCBA demonstrate strong profitability and operational efficiency, proving that strategic execution matters as much as scale. 3. Digital Banking Is a Competitive Advantage Banks with stronger digital transaction capabilities continue outperforming peers in customer engagement, scalability, and operational efficiency. 4. Lending & Deposit Growth Continue Driving Expansion Strong customer deposits and healthy loan books remain major indicators of sector growth and long-term sustainability. Why Executive Dashboards Matter Leadership teams do not need more spreadsheets. They need clear, decision-ready insights. Executive dashboards help answer: ✔️ What changed? ✔️ What matters most? ✔️ Where is risk emerging? ✔️ What action should leadership take? How Intersect Analytics Helps Businesses We help organizations transform manual reporting into intelligent decision systems through: 📊 Power BI Executive Dashboards 📈 Financial Analysis & Forecasting ⚙️ Excel, Google Sheets & Workflow Automation 🗄️ Business Intelligence & Data Analytics 🔍 KPI Tracking & Executive Reporting Why Choose Intersect Analytics? ✅ Executive-focused dashboards ✅ Clean, decision-driven reporting ✅ Automation that saves time ✅ Strategic insights for growth We build solutions that help leaders understand faster, decide smarter, and grow confidently. DECISIONS BACKED BY DATA. GROWTH DRIVEN BY INSIGHT. 📱 WhatsApp: +254 723 632 207
0
11
Visually captivating graphic designer

🎥 Expert Video Editing & Content Creation Guru