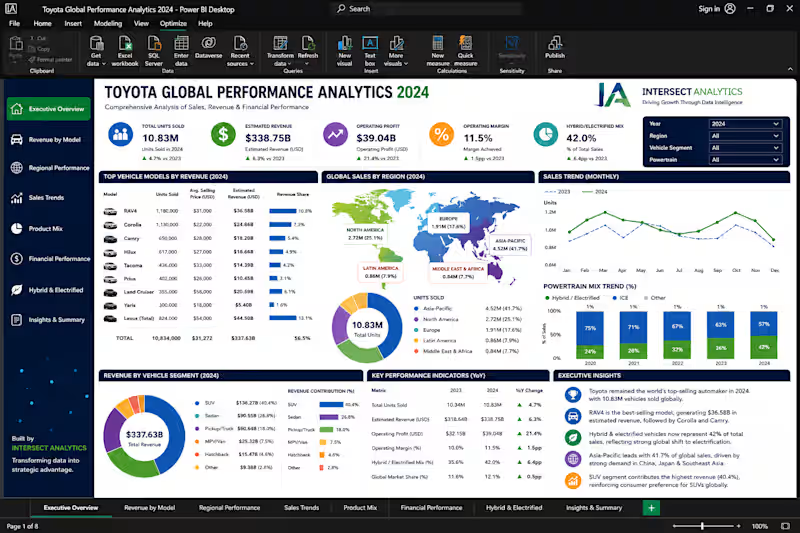
Business Analysis Projects in NairobiBusiness Analysis Projects in Nairobi📊 Toyota Global Performance Dashboard — Quick Analysis by Intersect Analytics
We recently came across Toyota’s global automotive data and carried out a quick Power BI-driven business intelligence analysis to uncover the trends driving performance, revenue, and market dominance.
Key Findings:
🚗 RAV4 emerged as a major revenue driver, reinforcing the growing dominance of SUVs in the global automotive market.
🌍 Asia-Pacific remains Toyota’s strongest-performing region, contributing the largest share of global vehicle sales and market influence.
⚡ Hybrid & electrified vehicles continue gaining momentum, signaling a strong transition toward sustainable and future-focused mobility.
📈 Toyota maintained impressive global sales performance, with a small number of flagship models driving a significant share of total revenue.
💡 What does this tell us?
The businesses leading today are not necessarily those with the most data — but those that understand how to use it strategically.
At Intersect Analytics, we specialize in transforming raw business data into strategic insights, executive dashboards, automation systems, and business intelligence solutions that improve decision-making and unlock growth opportunities.
Our services include:
✅ Power BI Dashboard Development
✅ Business Intelligence & Data Analytics
✅ Workflow Automation Across Multiple Platforms
✅ Financial, Sales & Operational Analytics
✅ Executive Reporting & KPI Tracking
✅ SQL, Python, Excel & Cloud Analytics Solutions
✅ AI-Powered Reporting & Predictive Insights
Whether you operate in finance, logistics, healthcare, retail, manufacturing, or e-commerce, we help organizations transform complexity into clarity through data visualization, automation, and advanced analytics.
Because data alone does not create growth.
Insights do.
DECISIONS BACKED BY DATA.
GROWTH DRIVEN BY INSIGHT.
📱 WhatsApp: +254 723 632 207
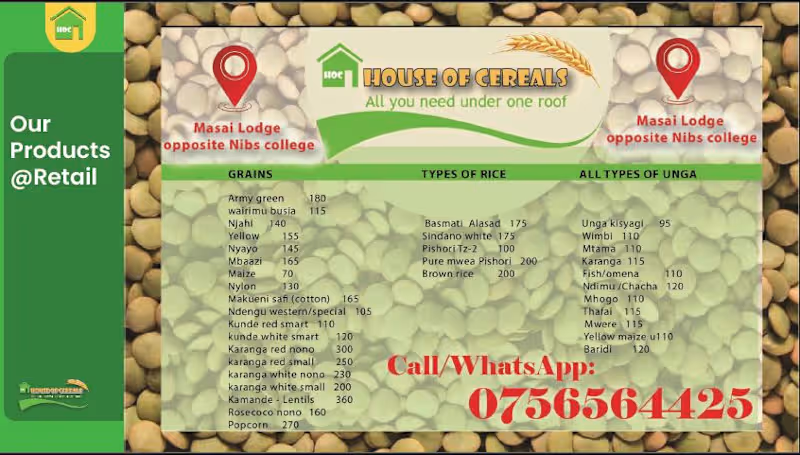
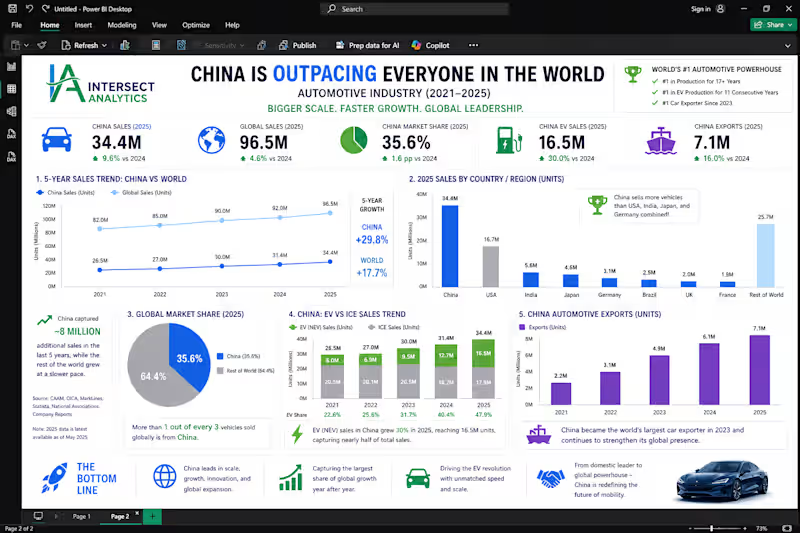
#DataAnalytics #BusinessIntelligence #PowerBI #DashboardDesign #Automation #FinancialAnalytics #SQL #DataVisualization #AI #DigitalTransformation #Toyota #BusinessGrowth A Nairobi wholesale/retail business needed a clear path to start and later to grow. I developed a full market entry and expansion strategy covering research,proposals,contracts,SOPs,COCs, Marketing, branding, advertising and ROI projections. Later, they wanted to expand to wholesalers and mart status, I Introduced new product lines, supplier sourcing, mark up with profitable pricing, made inventory allocation percentages, and a phased stocking roadmap. Delivered as an actionable plan the owner could implement immediately. I was hired as Ops manager as a result of good results This dashboard delivers a comprehensive 5-year analysis (2021–2025) of the global automotive industry, clearly highlighting how China has emerged as the undisputed market leader.
The data reveals that China is not only the largest automotive market globally, but also the fastest-growing, now accounting for over 35% of global vehicle sales. With strong growth in electric vehicles (EVs), exports, and total production, China is capturing the majority of global industry expansion while other major economies grow at a slower pace.
Key insights from the dashboard include:
China’s sales growth significantly outpaces global averages
Rapid acceleration in EV adoption, nearing half of total sales
Strong export growth positioning China as a global automotive powerhouse
A widening gap between China and other major markets like the USA, Japan, and Germany
💼 About Our Services – Intersect Analytics
At Intersect Analytics, we specialize in transforming complex data into clear, actionable insights that drive strategic decision-making.
Our core services include:
📊 Interactive Dashboard Development (Power BI, Tableau)
📈 Data Analysis & Business Intelligence
🔍 Market Research & Industry Insights
🤖 Data Automation & Reporting Solutions
📉 Financial & Operational Analytics
⭐ Why Choose Intersect Analytics?
Data-Driven Precision – We go beyond visuals to deliver insights that matter
Business-Focused Approach – Every dashboard is tailored to support real decisions
Advanced Technical Expertise – Skilled in Power BI, SQL, Python, and financial modeling
Clean, Executive-Ready Designs – Dashboards that are both insightful and visually compelling
Fast Turnaround, High Impact – We deliver quality solutions efficiently
🎯 The Bottom Line
This dashboard is more than just a visual—it’s a strategic tool that clearly shows how global dynamics are shifting, with China leading the future of the automotive industry.
👉 With Intersect Analytics, you don’t just get data—you get clarity, direction, and a competitive edge. 🌍 Electric Vehicle Market Overview & Key Findings
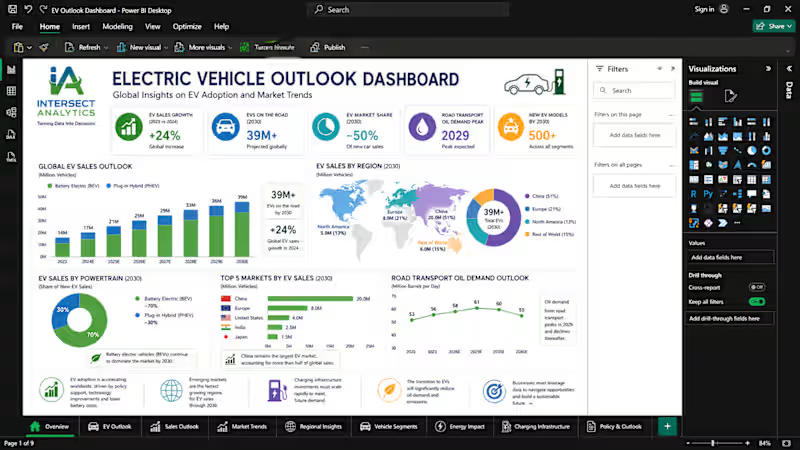
This dashboard presents a comprehensive analysis of the global shift toward electric mobility, highlighting trends in EV adoption, sales growth, and market dynamics across key regions.
📊 Key Findings:
The global EV market is experiencing rapid acceleration, driven by policy support, technological advancements, and increasing environmental awareness.
Asia, particularly China, continues to dominate EV adoption, while Europe and North America show strong and consistent growth.
EV sales are steadily outpacing traditional internal combustion engine (ICE) vehicles, signaling a structural shift in the automotive industry.
Market expansion is supported by improvements in battery technology, cost reductions, and increased investment in charging infrastructure.
🔮 Market Outlook
EV adoption is projected to continue growing significantly over the next decade, with millions of new electric vehicles entering the market annually.
Emerging markets present untapped growth opportunities, although infrastructure and affordability remain key challenges.
The transition to electric mobility is expected to reshape global energy demand, reducing reliance on fossil fuels and accelerating sustainability goals.
Companies that leverage data-driven insights will be better positioned to navigate this evolving landscape and capture market share.
🚀 Powered by Intersect Analytics
At Intersect Analytics, we go beyond dashboards—we deliver actionable intelligence.
We help businesses:
✅ Transform raw data into strategic insights
✅ Build interactive Power BI dashboards
✅ Perform advanced Python data analysis
✅ Develop predictive models & forecasts
✅ Optimize operations through data-driven decision-making
📩 Whether you're in automotive, energy, finance, or consulting, we help you turn complex data into clear, actionable strategies that drive growth.
Let’s unlock the power of your data. 🌍 Middle East Market Insights: Top 20 Leading Companies (2024)
What drives growth and profitability in the Middle East?
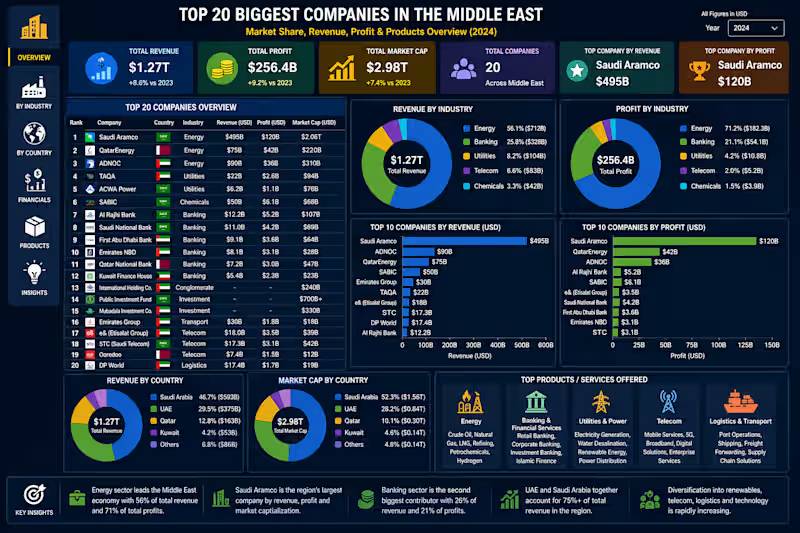
Using advanced data analytics, Python, and Power BI dashboards, we analyzed the region’s top companies across energy, banking, telecom, and logistics—uncovering where the biggest opportunities lie.
📊 Key insights:
✔ Energy dominates revenue and profit across the region
✔ Banking and telecom sectors show strong, stable growth
✔ Rapid diversification into technology, renewables, and infrastructure
At Intersect Analytics, we help businesses across the Middle East unlock the full potential of their data through:
✅ Power BI Dashboard Development
✅ Advanced Python Data Analysis
✅ Financial & Business Intelligence Solutions
✅ Predictive Analytics & Reporting Automation
🚀 Whether you're in UAE, Saudi Arabia, Qatar, or beyond, we deliver data-driven insights that drive smarter decisions and measurable growth.
📩 Let’s work together to turn your data into a competitive advantage.
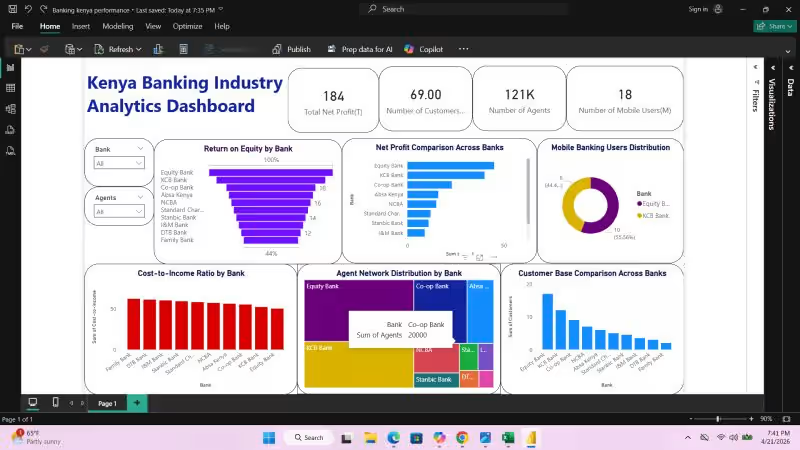
#DataAnalytics #MiddleEastBusiness #PowerBI #BusinessIntelligence #DataVisualization #Python #FinancialAnalysis #DashboardDesign #UAE #SaudiArabia #AnalyticsServices Came across this 2025 dataset on the Kenyan banking sector and ran a quick analysis through our Power BI framework at Intersect Analytics—here’s what we uncovered:
📊 Key Findings
• Equity Bank dominates the market, leading in net profit, customer base, and agent network—a clear indication of its strength in both digital and physical banking
• KCB Bank and Co-operative Bank of Kenya remain strong competitors, with solid profitability and a wide customer reach
• Return on Equity (ROE) highlights a clear divide—top-tier banks are significantly more efficient in generating returns, pointing to strong capital management
• Cost-to-Income ratios reveal operational gaps—some banks are highly optimized, while others face cost inefficiencies that impact profitability
• Digital banking is the game changer—banks with larger mobile user bases and agent networks are outperforming others
• The customer base distribution shows clear market concentration, with tier-1 banks leveraging scale and accessibility to maintain dominance
💡 Intersect Analytics Perspective
Even from this quick analysis, it’s clear that:
✔ Data-driven banks outperform competitors
✔ Digital transformation is driving market leadership
✔ Operational efficiency is key to profitability
🛠️ Our Services at Intersect Analytics
We don’t just analyze data—we build systems that help businesses act on it:
• Power BI Dashboard Development
• Data Cleaning, Transformation & Modeling
• Automation (Excel, Python, SQL, Google Apps Script)
• Custom Script Development for Reporting & Operations
• Business Intelligence & Advanced Analytics
🎯 Why Intersect Analytics
✔ Clean data = reliable insights
✔ End-to-end analytics solutions
✔ Business-focused dashboards (not just visuals)
✔ Automation that saves time and reduces errors
✔ Insights that drive real decision-making
📩 Looking to build something like this for your business?
📞 +254 723 632207 (WhatsApp Available)
💡 Intersect Analytics — Powering insights. Driving decisions. 🚀 Preliminary Data Analytics Report | Unlock Powerful Business Insights with Intersect Analytics
What if you could clearly see where your revenue comes from, which products drive profit, and how to scale your business efficiently?
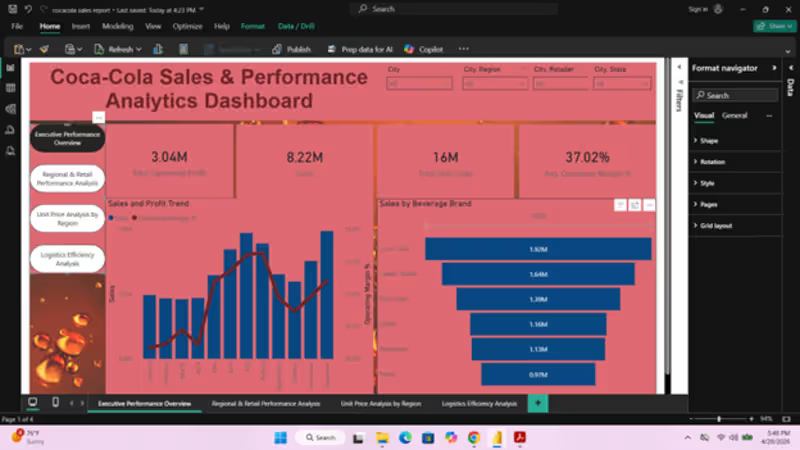
Our preliminary Coca-Cola Sales & Performance analysis demonstrates the kind of powerful insights we deliver through advanced data analytics and business intelligence solutions.
📊 Preliminary Insights That Drive Smarter Decisions
From this initial dashboard review, we identified:
• $8.22M Total Sales with consistent growth trends
• $3.04M Operating Profit highlighting strong financial performance
• 37.02% Average Operating Margin – a sign of efficient cost control
• 16 Million Units Sold – indicating strong product demand and market reach
🥤 Brand Performance Snapshot:
• Coca-Cola leads with $1.92M in sales
• Dasani Water and Diet Coke are key revenue drivers
• Opportunity exists to improve performance of lower-tier brands
📈 Key Insight:
This preliminary analysis shows profitable and scalable growth, supported by strong margins and high-volume sales.
💡 What This Means for Your Business
✔ Identify high-performing products and revenue drivers
✔ Optimize pricing and cost structures
✔ Improve forecasting using real data trends
✔ Make faster, data-driven strategic decisions
🛠️ Our Services at Intersect Analytics
We help businesses achieve results like this through:
• Power BI Dashboard Development (Sales, Finance, Operations, HR)
• Data Cleaning, Transformation & Modeling
• Automation (Excel, Python, Google Apps Script)
• SQL Database Management & Optimization
• Advanced Data Analysis & Business Intelligence
• Financial & Performance Reporting
🎯 Why Choose Intersect Analytics?
✔ We start with clean, reliable data (no misleading insights)
✔ We deliver end-to-end analytics solutions
✔ We combine business understanding with technical expertise
✔ We build interactive dashboards that drive real decisions
✔ We focus on results, not just visuals
📈 Turn Your Data Into a Competitive Advantage
This is just a preliminary report—imagine what deeper analysis and a fully optimized system can reveal for your business.
📩 Ready to unlock the full value of your data?
📞 +254 723 632207 (WhatsApp Available)
💡 Intersect Analytics — Turning raw data into actionable business intelligence.