The network for creativity
Join 1.25M professional creatives like you
Connect with clients, get discovered, and run your business 100% commission-free
Creatives on Contra have earned over $150M and we are just getting started
Back to feedPost

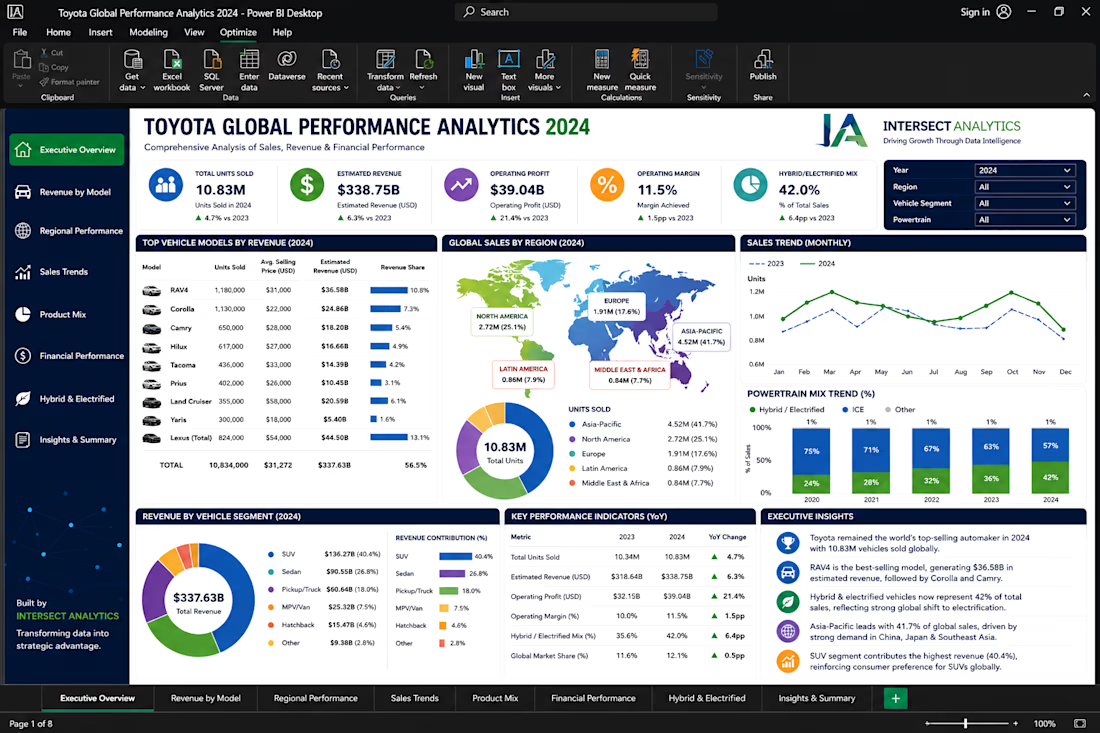
📊 Toyota Global Performance Dashboard — Quick Analysis by Intersect Analytics
We recently came across Toyota’s global automotive data and carried out a quick Power BI-driven business intelligence analysis to uncover the trends driving performance, revenue, and market dominance.
Key Findings:
🚗 RAV4 emerged as a major revenue driver, reinforcing the growing dominance of SUVs in the global automotive market.
🌍 Asia-Pacific remains Toyota’s strongest-performing region, contributing the largest share of global vehicle sales and market influence.
⚡ Hybrid & electrified vehicles continue gaining momentum, signaling a strong transition toward sustainable and future-focused mobility.
📈 Toyota maintained impressive global sales performance, with a small number of flagship models driving a significant share of total revenue.
💡 What does this tell us?
The businesses leading today are not necessarily those with the most data — but those that understand how to use it strategically.
At Intersect Analytics, we specialize in transforming raw business data into strategic insights, executive dashboards, automation systems, and business intelligence solutions that improve decision-making and unlock growth opportunities.
Our services include:
✅ Power BI Dashboard Development
✅ Business Intelligence & Data Analytics
✅ Workflow Automation Across Multiple Platforms
✅ Financial, Sales & Operational Analytics
✅ Executive Reporting & KPI Tracking
✅ SQL, Python, Excel & Cloud Analytics Solutions
✅ AI-Powered Reporting & Predictive Insights
Whether you operate in finance, logistics, healthcare, retail, manufacturing, or e-commerce, we help organizations transform complexity into clarity through data visualization, automation, and advanced analytics.
Because data alone does not create growth.
Insights do.
DECISIONS BACKED BY DATA.
GROWTH DRIVEN BY INSIGHT.
📱 WhatsApp: +254 723 632 207
#DataAnalytics #BusinessIntelligence #PowerBI #DashboardDesign #Automation #FinancialAnalytics #SQL #DataVisualization #AI #DigitalTransformation #Toyota #BusinessGrowth


The network for creativity
Join 1.25M professional creatives like you
Connect with clients, get discovered, and run your business 100% commission-free
Creatives on Contra have earned over $150M and we are just getting started





Related posts

I designed and developed a Spotify-inspired Music Analytics Dashboard in Microsoft Power BI, combining data modelling, DAX, interactive navigation, and custom dashboard design into a single analytical experience.
The dashboard allows users to explore music data from different perspectives — from overall performance and popularity to individual artists, songs, albums, and trends over time.
What I built
- Overview Dashboard — high-level KPIs and music performance trends
- Artist Analytics — artist rankings, song counts, popularity and catalogue analysis
- Song Analytics — song popularity, duration, year-wise analysis and album insights
- Interactive Navigation — seamless movement between dashboard sections
- Dynamic Visual Analysis — monthly trends, popularity patterns and category comparisons
- Detailed Data Tables — deeper exploration beyond summary-level KPIs
- Spotify-inspired UI — dark, modern interface designed around the visual identity of a music streaming platform
Key metrics explored
- 342 Artists
- 789 Distinct Songs
- 562 Albums
- Average Song Duration: 3.28 minutes
- Average Popularity: 90
Tools & Skills
Power BI · DAX · Data Modeling · Data Visualization · Interactive Dashboard Design · KPI Development · Business Intelligence
The goal wasn't simply to create another Power BI report — it was to make the data explorable, intuitive and visually engaging.
Interested in turning your own data into an interactive Power BI dashboard? Let's connect.

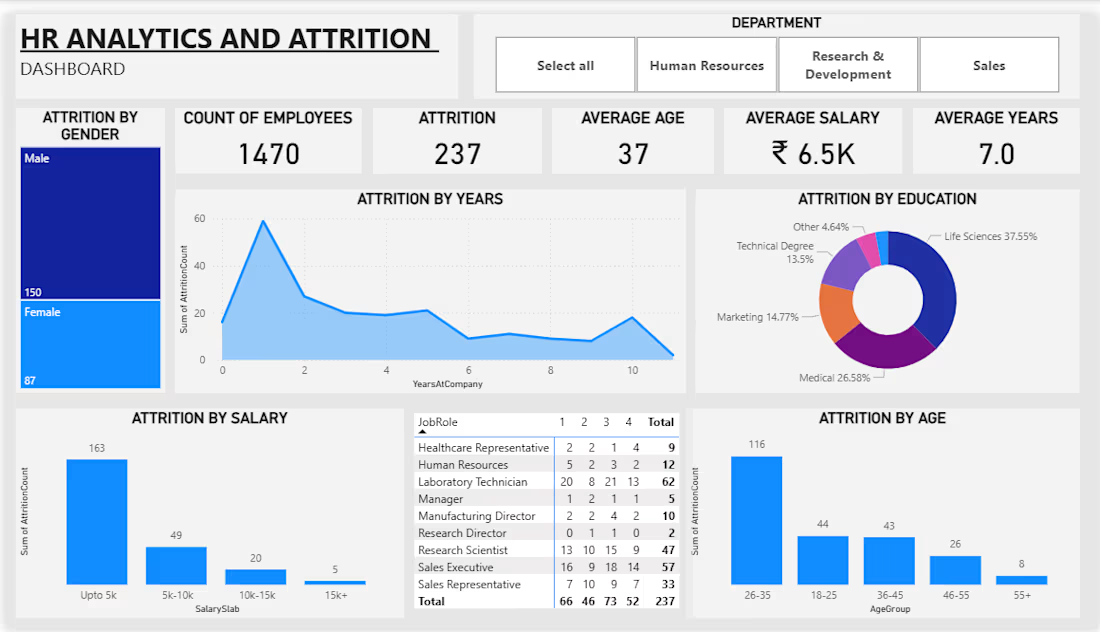
Developed an interactive HR Analytics & Attrition Dashboard in Power BI to analyze employee attrition and workforce trends. Analyzed 1,470 employee records across age groups, salary levels, and departments, using KPI cards, charts, filters, and DAX to deliver actionable workforce insights.

I designed and engineered this interactive astronomical almanac for Ephemeris.
Blending nineteenth century celestial cartography with responsive data visualization required coordinating intricate astronomical calculations with period print typography. Programming a rotatable calendar dial that recalculates the night sky in real time, projecting accurate planetary alignments and lunar phases alongside a cataloged archive spanning 174 historical editions, turned complex ephemeris tables into an engaging visual experience.😊 👍


